6
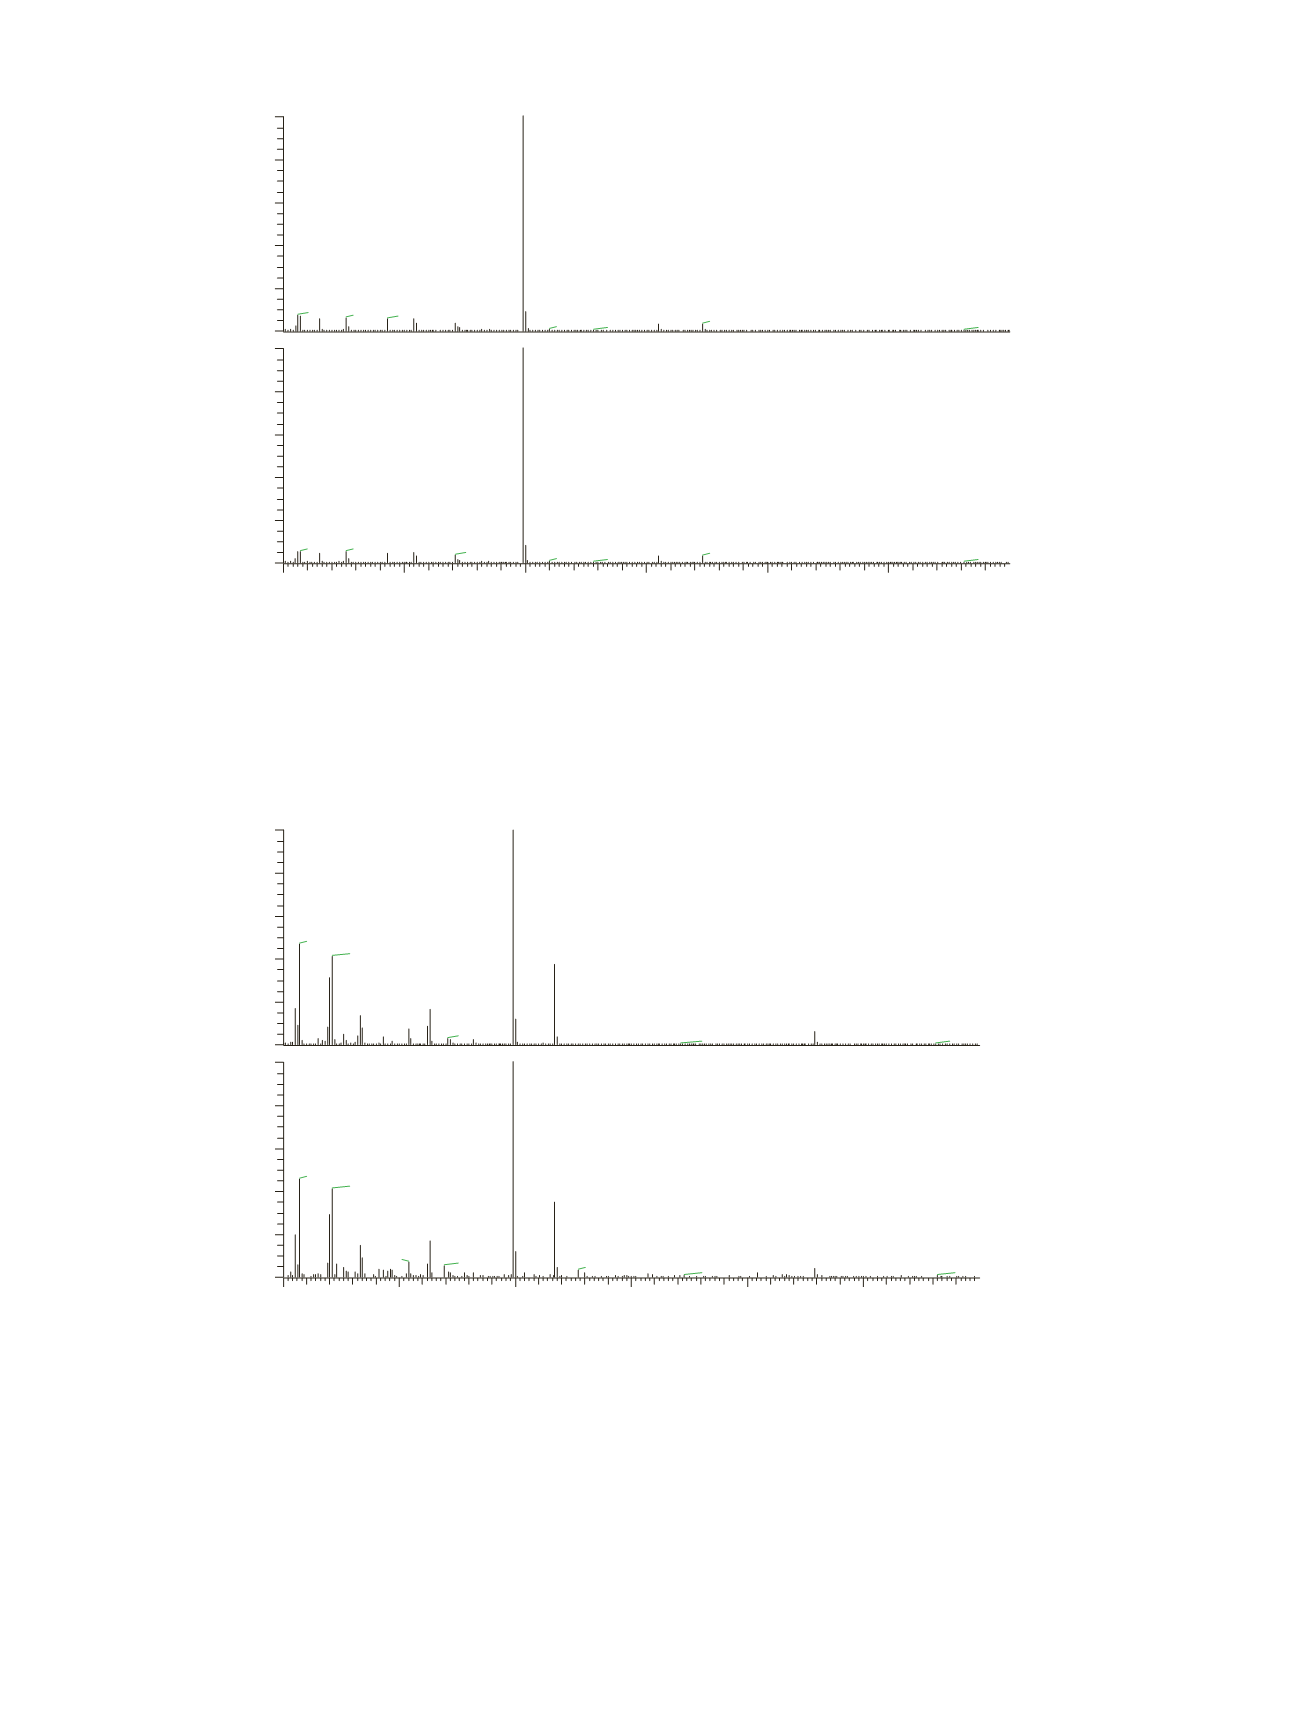
Figure 6.Dibutyl-phthalate spectra from standard (top) and sample (bottom).
Figure 7. Di-(2-ethylhexyl) phthalate spectra from standard (top) and sample (bottom).
50
100
150
200
250
300
m/z
0
20
40
60
80
100
0
20
40
60
80
100
Relative Abundance
149.06
56.12 76.05 93.07 121.07
205.14 223.16
160.14
278.20
178.15
250.17
315.26 331.19
149.04
57.09 76.04 104.03 121.05
205.13 223.12
160.09
278.16
178.11
250.16
315.08 331.19
NL: 3.02E8
20121121-pae-
4ppm#2567 RT:
16.73 AV: 1 T: {0,0}
+ c EI Full ms
[50.00-350.00]
NL: 1.85E8
20121122-
samp2#2561 RT:
16.71 AV: 1 T: {0,0}
+ c EI Full ms
[50.00-350.00]
50
100
150
200
250
300
m/z
0
20
40
60
80
100
0
20
40
60
80
100
Relative Abundance
149.06
57.11
71.13
167.07
113.18
83.12
279.23
121.06
207.08
253.03
62.13341.513
80.081
221.11
149.05
57.10
71.11
167.05
113.13
83.09
104.03 119.20
279.14
177.13
254.23
207.04
316.16
222.64
332.05
NL: 9.92E7
20121121-pae-
4ppm#3934 RT: 21.38
AV: 1 T: {0,0} + c EI Full
ms [50.00-350.00]
NL: 7.92E5
20121122-samp2#3929
RT: 21.36 AV: 1 SB: 2
21.28 , 21.45 T: {0,0} + c
EI Full ms [50.00-350.00]


