8
Sensitivity
The determination of the limit of detection (LOD)
and limit of quantitation (LOQ) were based on the
characteristic extracted ion mass chromatograms with a
Table 3. Phthalate Quantitation - Linearrange withlimit of detection (LOD) andlimit of quantification (LOQ), average R
2
0.9990.
Compound name
Retention
time
[min]
Quantitation ion
[m/z]
Linear
range
[mg/L]
Correlation
coefficient
R
2
LOD
[µg/L]
LOQ
[µg/L]
DMP
11.53
163
0.1-4.0
0.9994
0.1
0.3
DEP
13.02
149
0.1-4.0
0.9999
0.1
0.3
DIBP
15.64
149
0.1-4.0
0.9981
0.1
0.3
DBP
16.72
149
0.1-4.0
0.9986
0.1
0.3
DMPP
17.33/17.36
149
0.1-4.0
0.9993
0.2
0.6
DMEP
17.74
59
0.1-4.0
0.9984
0.2
0.6
DPP
18.43
149
0.1-4.0
0.9996
0.1
0.3
DEEP
18.59
72
0.1-4.0
0.9996
0.1
0.3
DHP
20.02
149
0.1-4.0
0.9990
0.1
0.3
BBP
20.94
149
0.1-4.0
0.9998
0.2
0.6
DEHP
21.37
149
0.1-4.0
0.9969
0.2
0.6
DBEP
21.45
149
0.1-4.0
0.9993
0.5
1.5
DCHP
22.50
149
0.1-4.0
0.9985
0.2
0.6
DOP
23.43
149
0.1-4.0
0.9998
0.5
1.5
DPhP
23.70
225
0.1-4.0
0.9988
0.2
0.6
DNP
24.0-24.4
149
0.4-4.0
0.9983
50
150
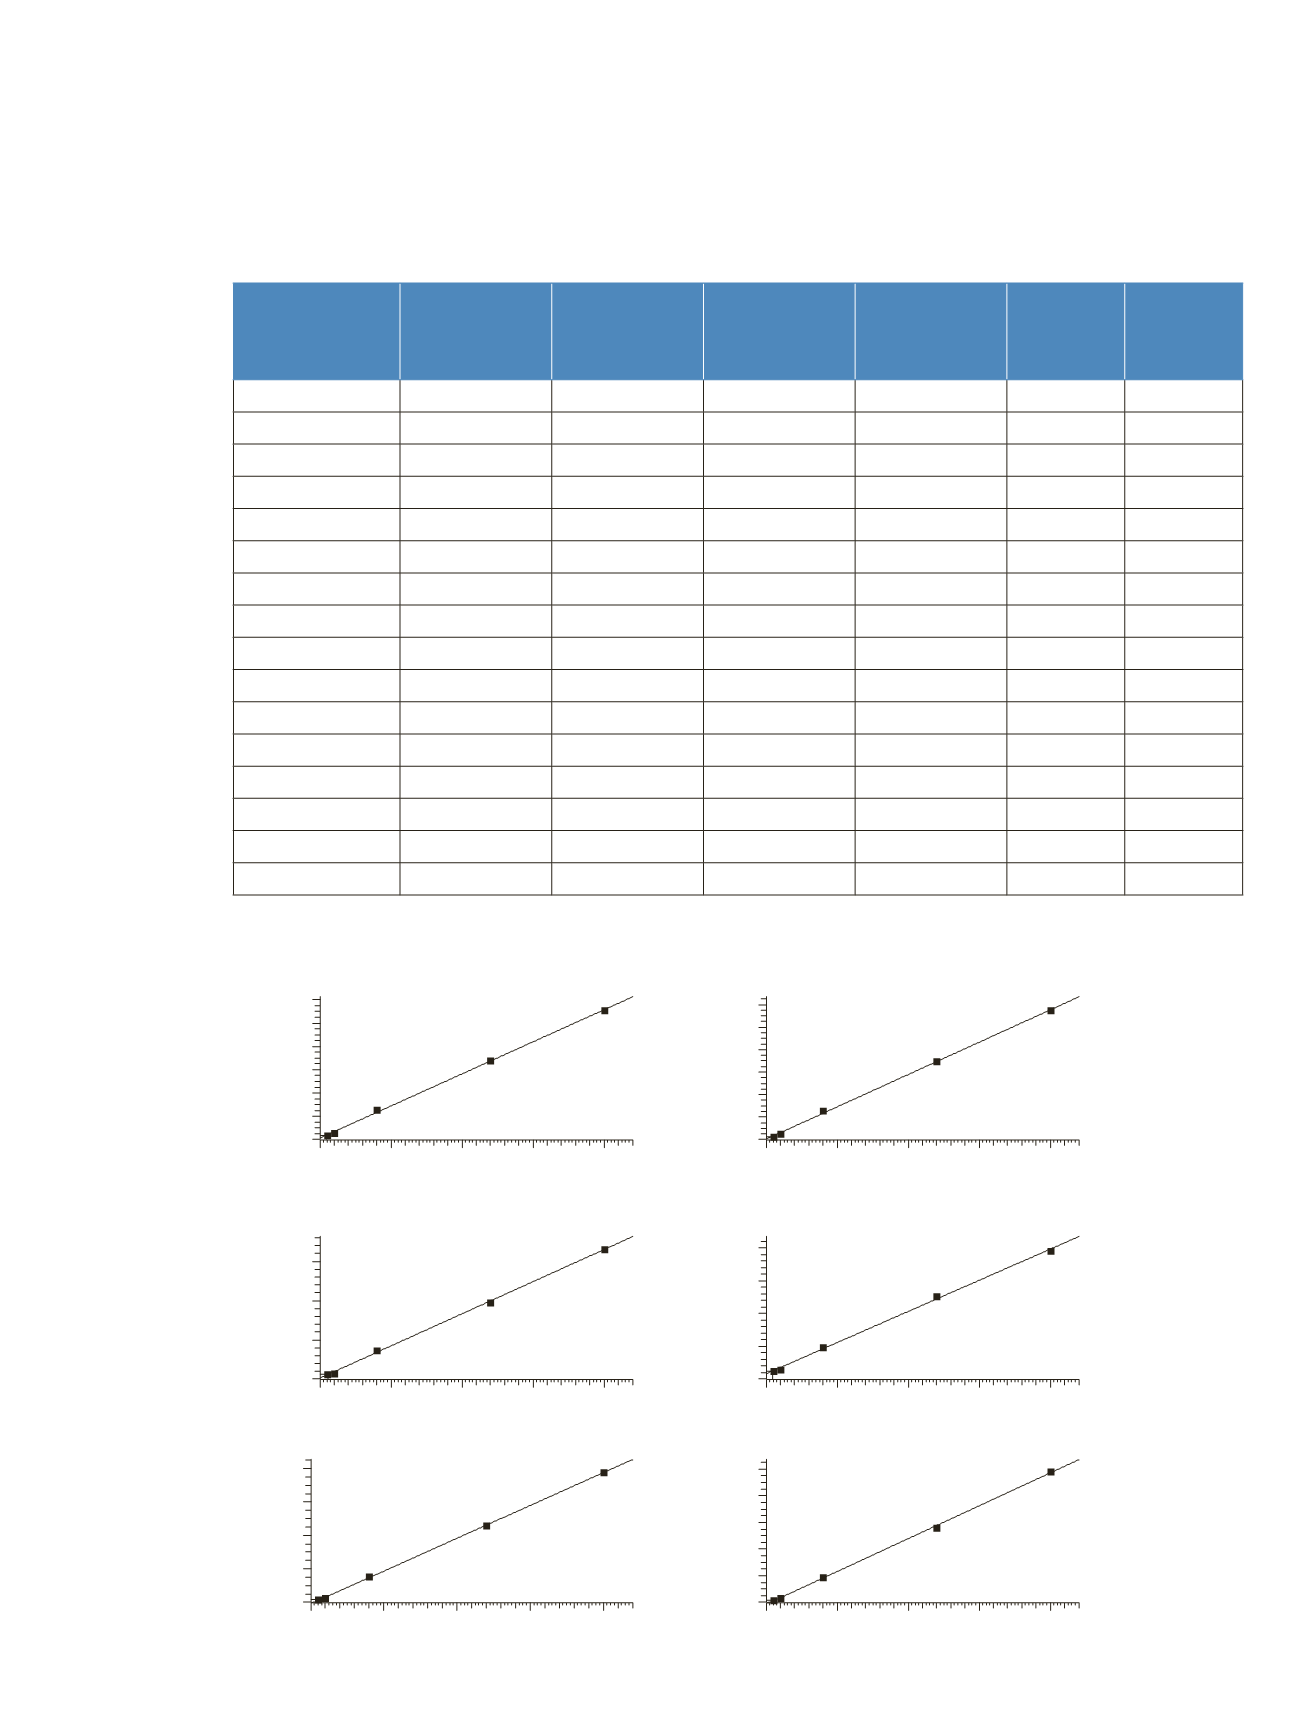
peak signal-to-noise ratio S/N ≥ 3 for LOD, and S/N ≥10
for LOQ, as given in Table 4. For the individual phthalate
compounds. Figure 10 shows the calibration curves of 16
PAE compounds.
DMP
Y= 1.39175e+006+2.75323e+007*X R^2 = 0.9993 W: Equal
0
1
2
3
4
mg/L
0
20000000
40000000
60000000
80000000
100000000
120000000
Area
DEP
Y= 421665+2.87386e+007*X R^2 = 0.9994 W: Equal
0
1
2
3
4
mg/L
0
20000000
40000000
60000000
80000000
100000000
120000000
Area
DIBP
Y= 1.55314e+006+4.08844e+007*X R^2 = 0.9992 W: Equal
0
1
2
3
4
mg/L
0
50000000
100000000
150000000
Area
DBP
Y= 8.44298e+006+4.74144e+007*X R^2 = 0.9983 W: Equal
0
1
2
3
4
mg/L
0
50000000
100000000
150000000
200000000
Area
DMEP
Y= -864551+1.95995e+007*X R^2 = 0.9998 W: Equal
0
1
2
3
4
mg/L
0
20000000
40000000
60000000
80000000
Area
DMPP
Y= -1.53383e+006+2.46966e+007*X R^2 = 0.9990 W: Equal
0
1
2
3
4
mg/L
0
20000000
40000000
60000000
80000000
100000000
Area


