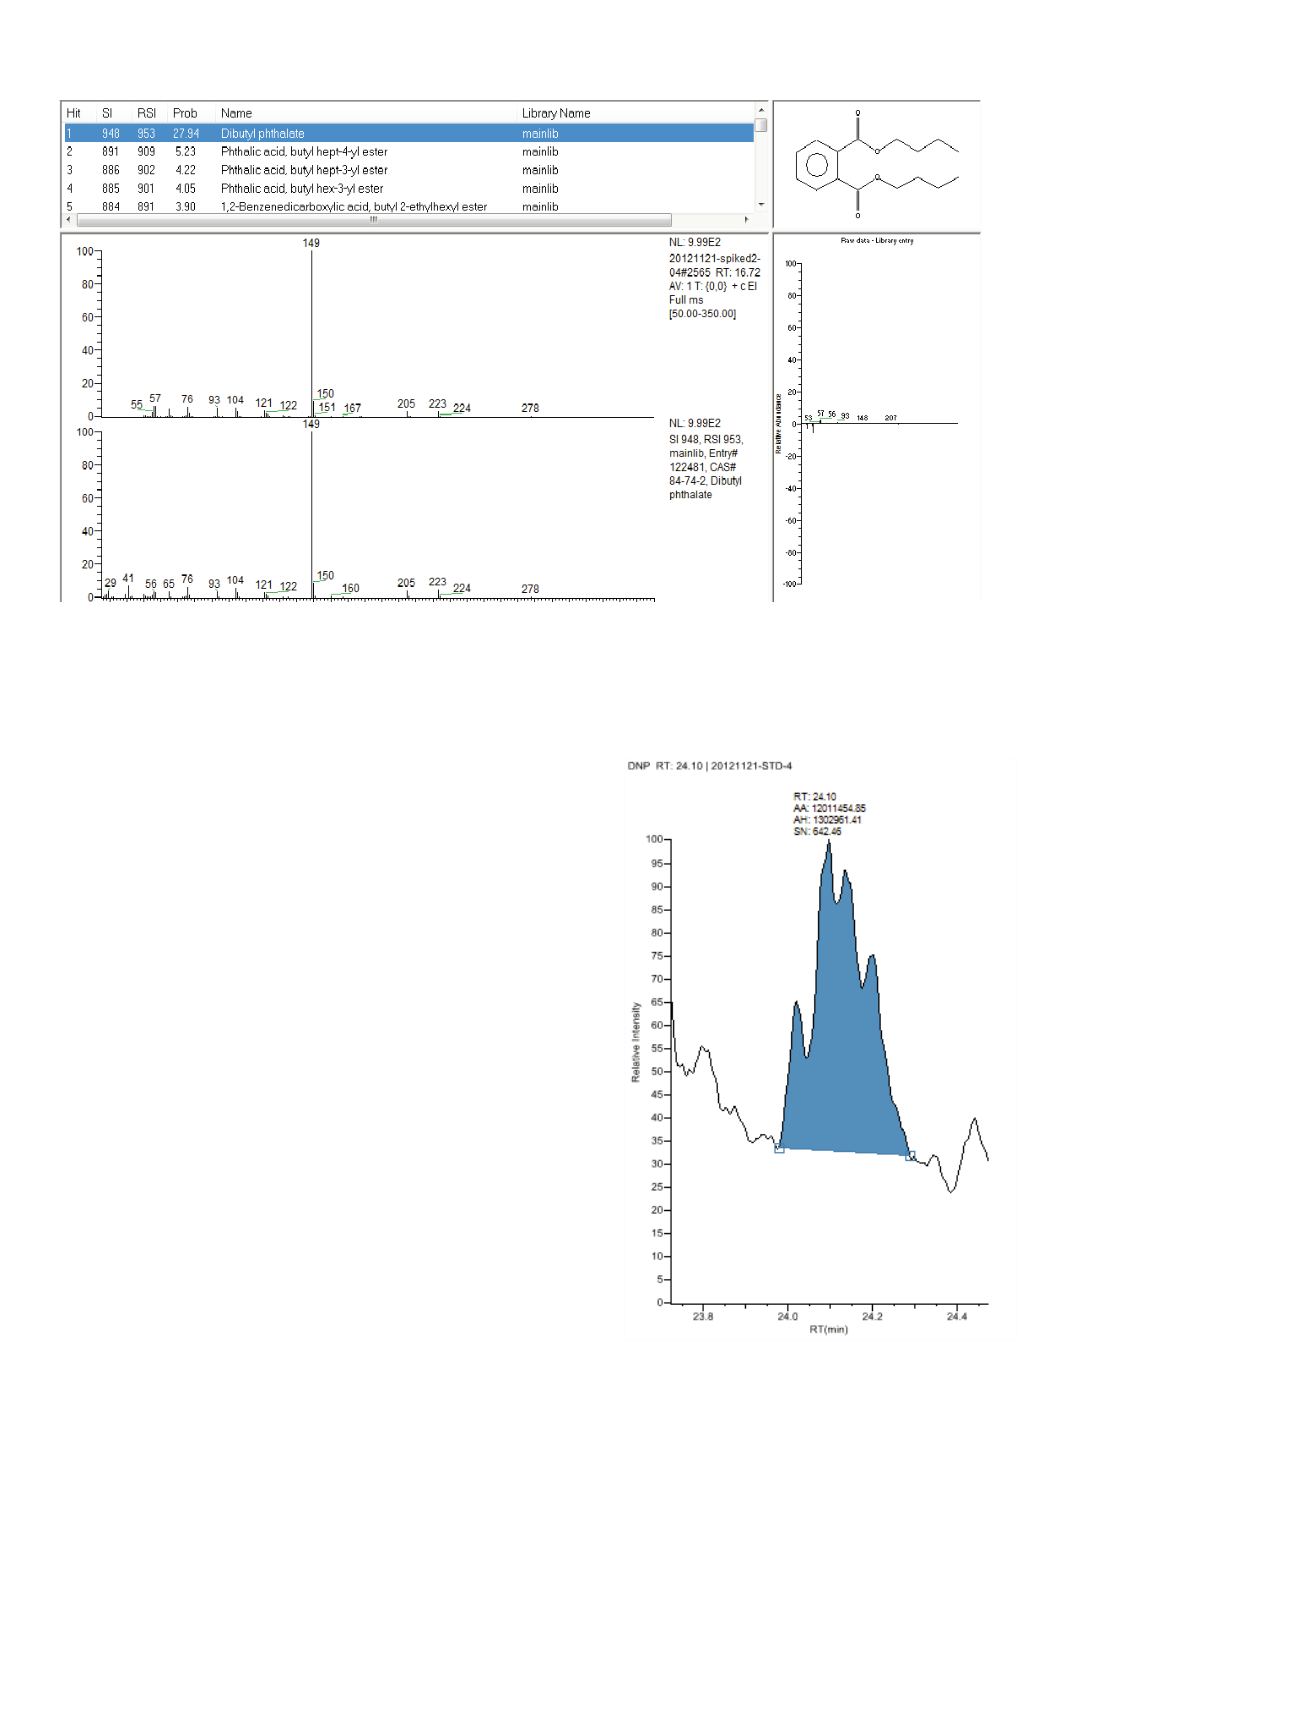
Figure 8. Comparison of spectra between the spiked sample (top) and NIST library (bottom) indicating a high match factors
(Similarity Index SI, Reversed Search Index RSI).
Quantitation
A series of matrix spiked samples with five different
concentrations was prepared in the range of 0.10 to 4.00
mg/L of the standard solution. The samples were injected
in sequence from low to high concentration. The peak
areas were calculated for the standard curve with linear
regression of very good precision with an average R
2
value of 0.999 for all PAE compounds. The results for 15
phthalate esters show a very good linear relationship in
the full calibration range of 0.10 to 4.00 mg/L.
The dinonyl-phthalates (DNP) create a special analytical
challenge. The DNPs typically consist of a mixture of
technical C9-isomers. Hence the response of DNP is
distributed to individual isomers. The integration of
the unresolved DNP peaks needs to be performed over
a wider but constant retention-time range, as shown
in Figure 9 from the applied Thermo Scientific™
TraceFinder™ software data processing. We could
achieve a linear calibration range for DNP of 0.40 to 4.00
mg/L.
7
Figure 9. Quantitation peaks of the unresolved DNP isomers over
a set retention time range using the TraceFinder quantitation
software.


