3
Results and Discussion
The results show good correlation factors and limits of
quantification <0.01 mg/m
2
for the majority of the
components analyzed.
Linearity of Standard Addition
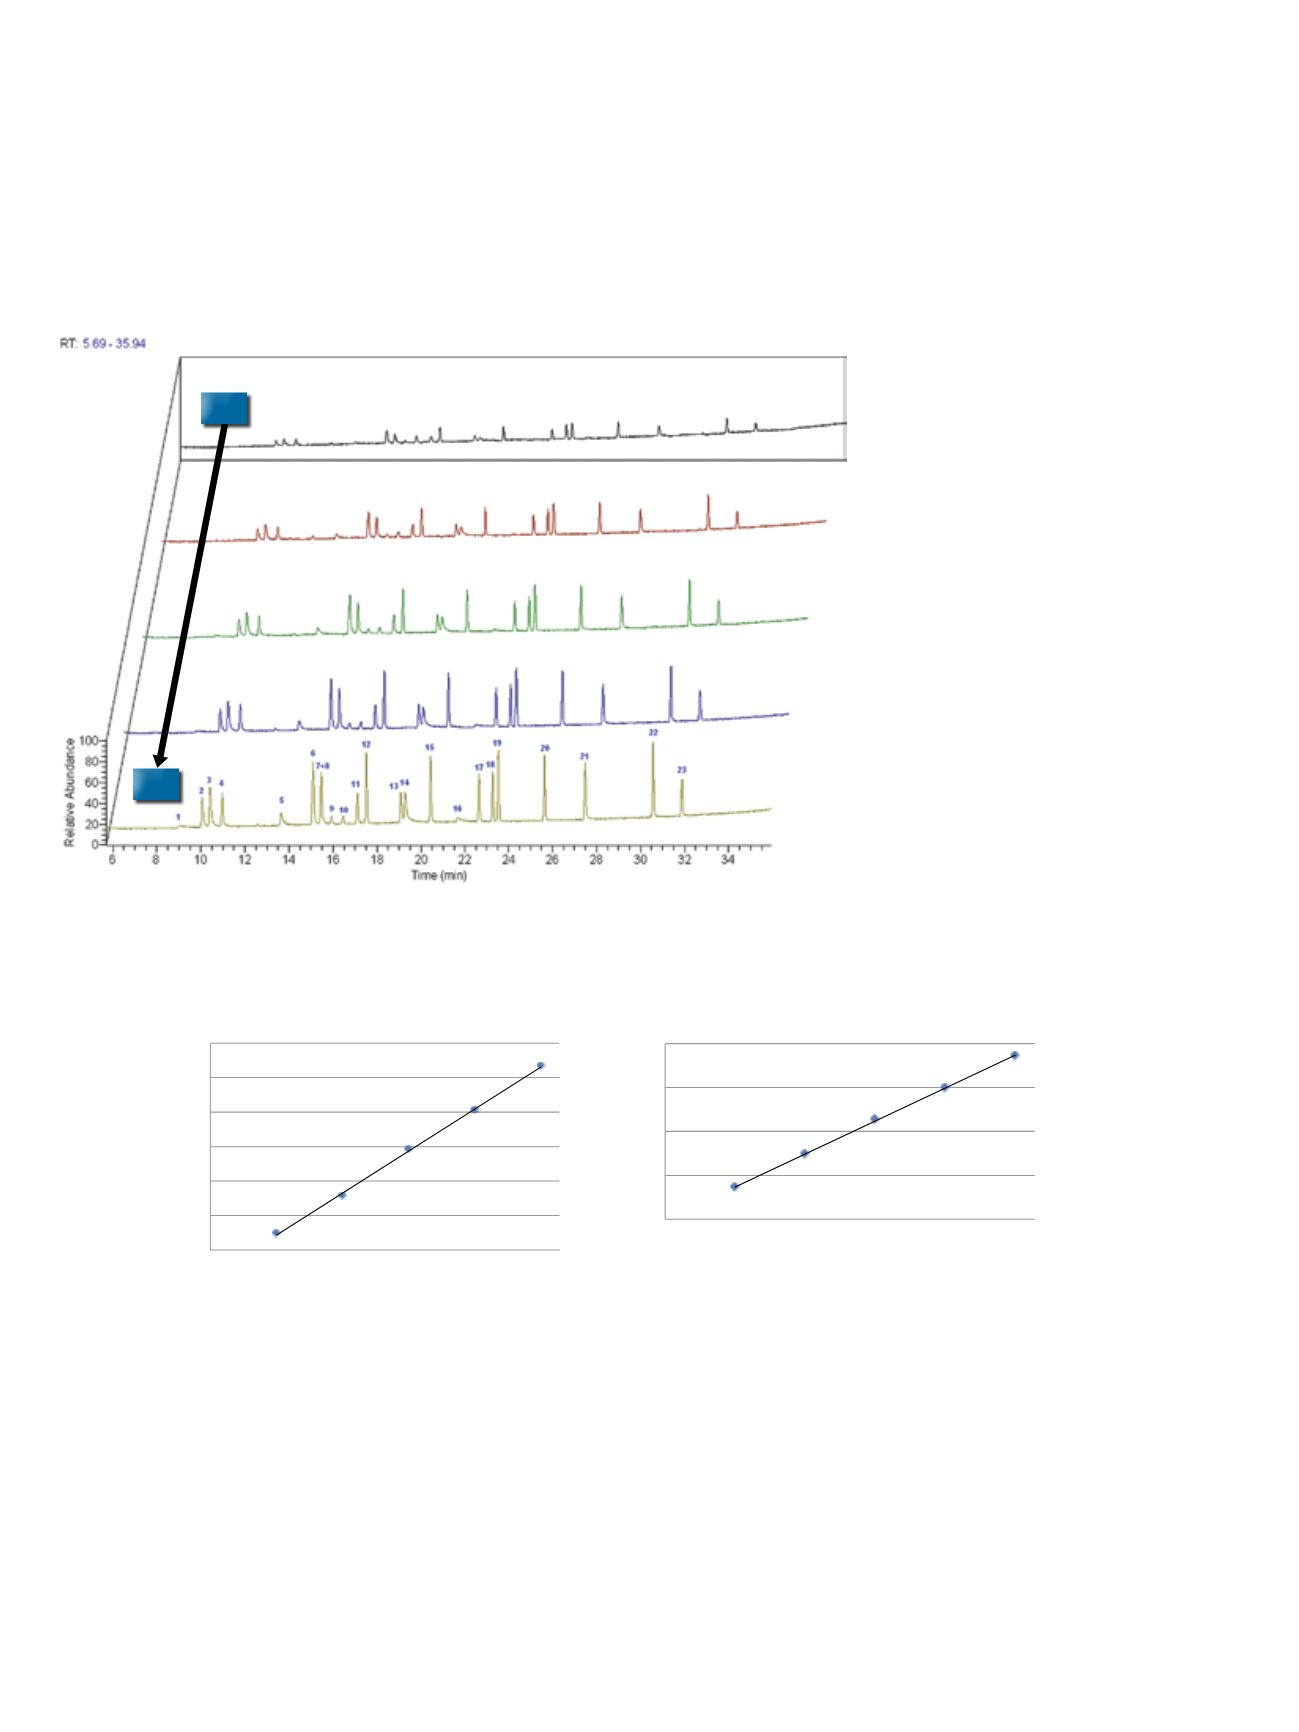
Figure 2 reports the list of components and the overlay of
chromatograms obtained for each volume of standard
(from 1 to 5 µL) added into empty vials.
The linearity of the system and the limits of quantification
for all components are derived by converting the data of
addition volumes into an absolute amount expressed in
mg/m
2
(assuming that the sample surface in the vial is
48 cm
2
). The graphs in Figure 3 show good linearity of
the system. Quantification limits below 0.01 mg/m
2
have
been calculated for all compounds except THF, ethanol,
and ethoxy ethanol.
Figure 3. System linearity for 1-propanol and isopropyl acetate.
Figure 2. Component list and overlay of chromatograms in the elution order.
5 µL
1 µL
Peaks:
1. ethanol
13.1-butanol
2. acetone
14.1-methoxy 2-propanol
3. 2-propanol
15. propyl acetate
4. methyl acetate 16. ethoxy ethanol
5. 1-propanol
17. 4-methyl 2-pentanone
6. 2-butanone
18. toluene
7. ethyl acetate
19. isobutyl acetate
8. 2-butanol
20. n-butyl acetate
9. THF
21. methyl cellosolve acetate
10. cyclohexane
22. 2-ethoxy ethyl acetate
11. isoutanol
23. cyclohexanone
12. isoprpyl acetate
0
200000
400000
600000
800000
1000000
1200000
0 0.005 0.01 0.015 0.02 0.0250.03 0.035 0.04 0.045 0.05
Peak area
Concentration mg/m
2
1-propanol
Peak area
isopropyl acetate
R
2
= 0.99973
R
2
= 0.99906
0
100000
200000
300000
400000
0
0.01
0.02
0.03
0.04
0.05
Concentration mg/m
2


