
6
Real-Time Qualitative and Quantitative Global Proteomics Profiling Using a Hybrid Data Acquisition Scheme
Conclusion
The pSMART acquisition method for global qualitative and quantitative analysis was
developed to increase performance of sample profiling for proteins and peptides that
could be used as putative biomarkers. The pSMART performance analysis resulted in
better data as compared to standard DIA methods based on:
Greater number of plasma peptides routinely identified
Significantly reduced number of decoy hits using multiple means of matching
Incorporation of Crystal spectral libraries facilitated real-time data analysis to
reduce post-acquisition processing time
pSMART method is easily adaptable for complex or simple samples as well as
different chromatographic peak shapes
References
1. Gillet, L.C., Navarro, P., Tate, S., Rost, H., Selevesk, N., Reiter, L., Bonner, R.,
Aebersold, R.,
Targeted data extraction of the MS/MS spectra generated by
data-independent acquisition: a new concept for consistent and accurate
proteome analysis.
Molecular & Cellular Proteomics, 2012.
11
: p. 1-17
2. Panchaud, A., Scherl, A., Shaffer, S. A., von Haller, P. D., Kulasekara, H. D.,
Miller, S. I., Goodlett, D. R.,
PAcIFIC: how to diver deeper into the proteomics
ocean.
Anal. Chem., 2009.
81
(15): p. 6481-6488.
3. Lam, H., Deutsch, E., W., Eddes, J. S., Eng, J. K., Stein, S. E., Aebersold, R.,
Building consensus spectral libraries for peptide identification in proteomics.
Nature Methods, 2008.
5
(10): p. 873-875.
uisition scheme. The real-time
er injection that can be
scheme to determine
sums the total number of
primary interest is the
tion. Of the 2525 peptides
all three replicates and ca.
standard DIA identified a total
ptides were verified across all
s identified in 2/3 replicates.
tified peptides across all
per method. Each list of
isplayed in Figure 3.
tides per data acquisition
ad to be identified in all three
the plasma peptide
ed using pSMART method. A)
+3 charge state and the inset
ashed line indicates the
id product ion XIC trace from
ct ions, ion type, and library
s from the standard DIA
duct ion distribution from each
256
724
889
10
656
463
DDA
pSMART
88
89
90
0
20
40
60
80
100
120
Abundance
m/z
Theoritical Isotopic Distribution
Experimental Isotopic Distribution
S1
m/z 1050.485 (y8) 100%
m/z 1163..569 (y9) 76%
+
m/z 935.458 (y7) 57%
m/z 679.340 (y5) 48%
y5
y7
y8
y9
Lib.
pSMART
PRM
DIA
0.0
10.0
20.0
30.0
40.0
50.0
60.0
70.0
80.0
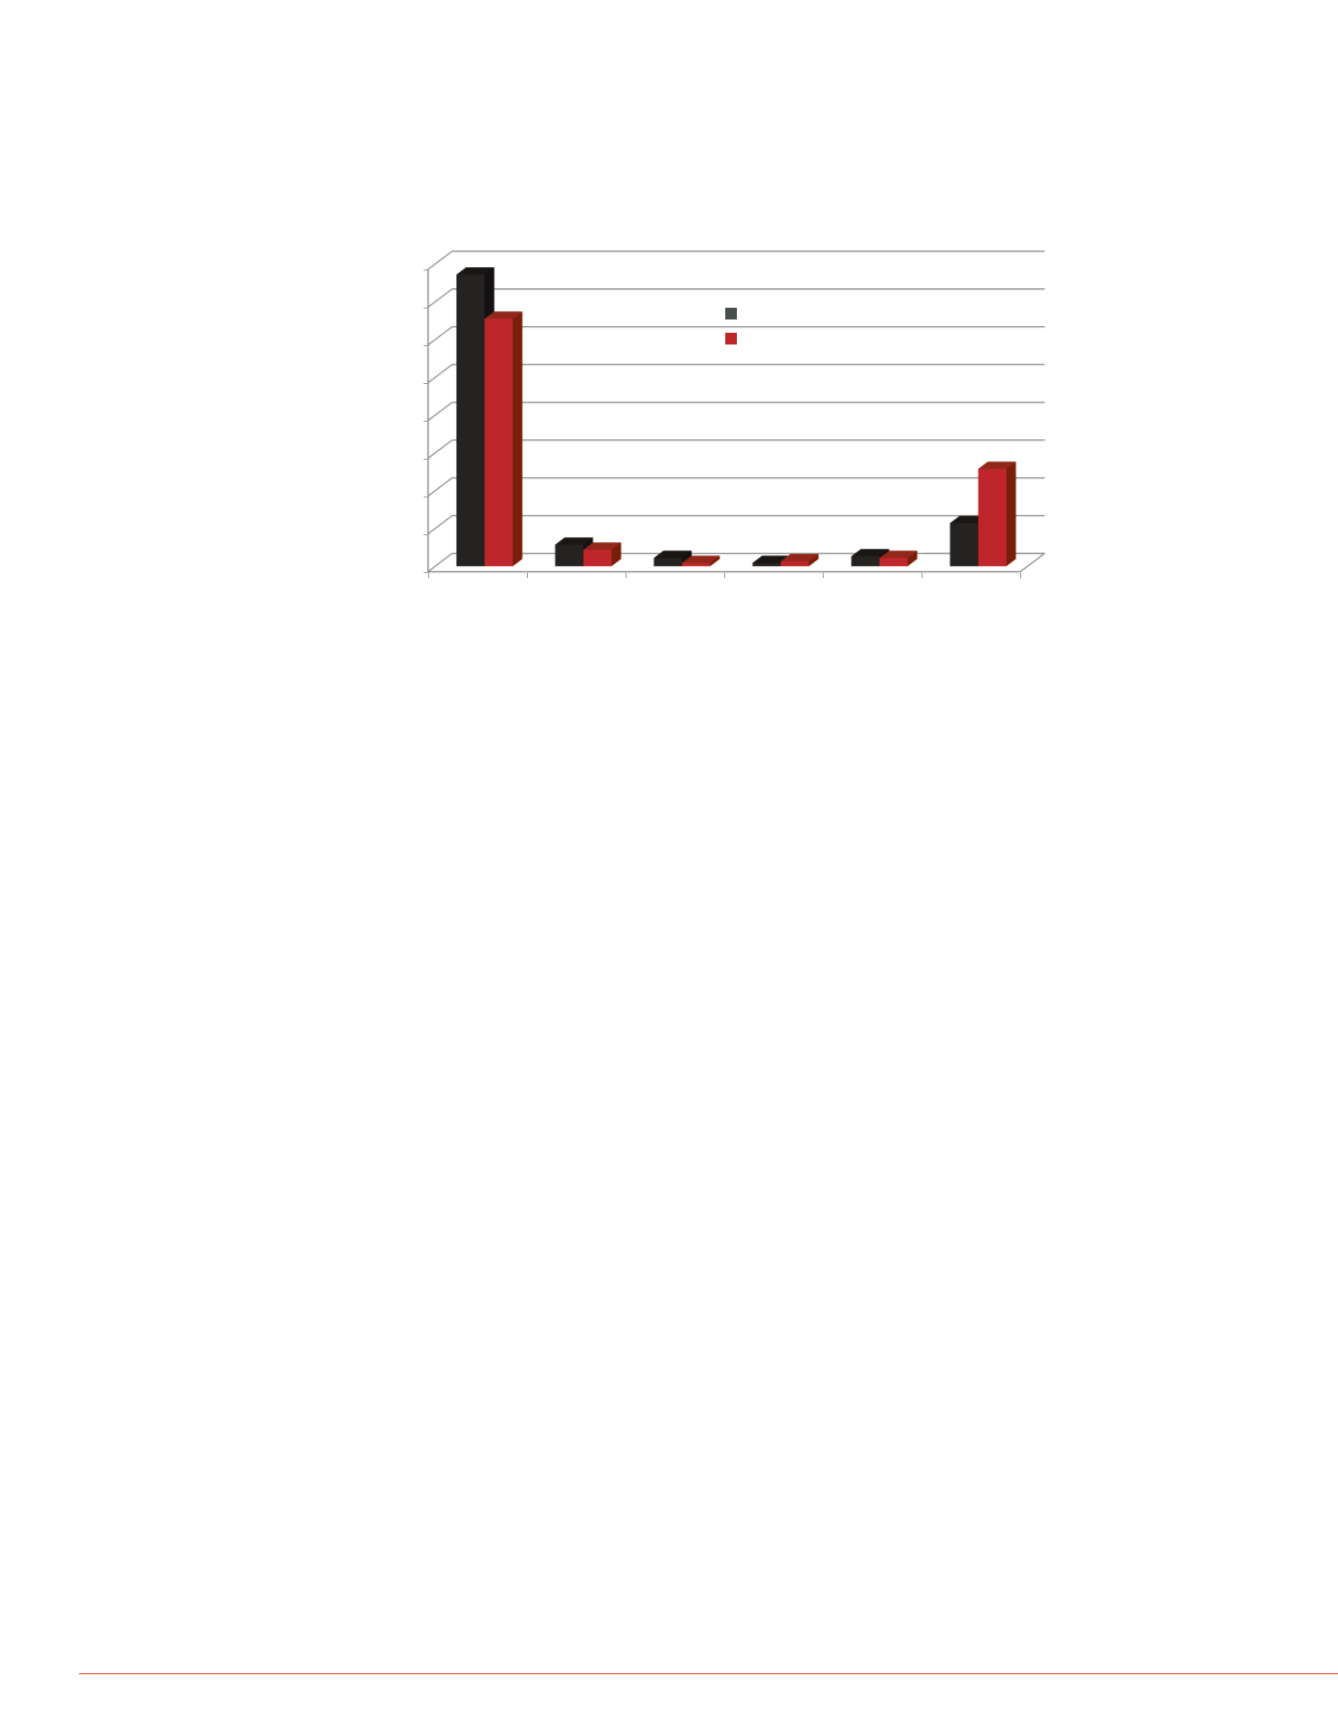
0-10%
11-15%
16-20%
21-30%
>30%
Missed
Frequency
%CV Range
SMART HR/AM MS
Standard DIA
Figure 5. Comparative reproducibility analysis of area values per data
acquisition method. The coefficient of variance was determined across the
three technical replicates. Area values for the pSMART data was determined
from precursor isotopic XICs compared to standard DIA experiments relying on
product ion XICs.
All trademarks are the property of Thermo Fisher Scientific and its subsidiaries.
This information is not intended to encourage use of these products in any manners that might infringe the
intellectual property rights of others.
PO64149-EN 0614S


