
3
Thermo Scientific Poster Note
•
PN-64149-ASMS-EN-0614S
uisition scheme for performing
is. Evaluate data acquisition
ods.
S used for quantitative analysis
onfirmation. Utilize
time data analysis to create a
l replicates.
ore peptides identified and
ly fewer decoy matches
nd quantitative sample
MS-driven MS/MS
of peptides across the gradient
s which can then determine
ta independent acquisition
ity to archive and interrogate
ease the sampling and
ents, we utilize high
metric DIA windows as
used for quantitative and
ess is predicated on leveraging
mass accuracy to increase
quisition strategy enables
ause only one high quality
row precursor isolation using
gs have shown greater
on the same samples.
f human plasma collected
abilized tube (Becton
an plasma was prepared
ols following reduction and
as estimated to be 4 mg/µL,
ntil used. Before MS analysis,
ibration (PRTC) peptides
tration of 20 fmol on column.
hermo Scientific
TM
EASY-
.2% formic acid in water and(B)
nto a 120 x 0.15 mm trapping
bs) and the analytical
packed with C18 Aq
ith a linear gradient from 5 to
mn regeneration.
as used for all experiments.
and peptide-based.
ime (pSMART) for data
25 Da precursor isolation
x ion fill times, 1e6 AGC
RT acquisition settings for MS
0) and DIA events were
r a precursor range of m/z
00-1200. Each narrow DIA
C settings, and 35,000
used to perform real-time data
Results
To determine performance of the pSMART acquisition strategy, experimental analysis
of non-depleted human plasma digest was compared to standard DIA data. The
evaluation metrics was confident matching as described above. In addition to spectral
matching, %CVs were used to determine reproducibility and quantitative capabilities
per method.
Data Analysis
Crystal spectral libraries were used to create a comprehensive list of plasma peptides
identified and verified based on DDA data acquired at BRIMS over the course of two
years and contains 10,288 peptides. The list of peptides contains the sequence (with
and without modifications), relative retention times, precursor charge states, product
ion m/z values and average product ion distribution. A custom script was used to
perform real-time spectral matching for both standard DIA and pSMART data to
spectral library information resulting in a final list of identified peptides per injection.
Real-time identification was based on retention time overlap, precursor/product ion
mass errors, and cosine similarity scoring between experimental product ion
distribution and spectral library information. Mass tolerance values were set to 10 ppm
for all pSMART data and CS scores of 0.6 or better. Standard DIA data was
processed using two different mass tolerance values, 10 and 20 ppm and a CS score
threshold of 0.7. Further scoring for standard DIA evaluated the consecutive spectral
matches based on mass accuracy and CS scores. The final list of identified peptides
was exported to the Pinpoint™ software for quantitation and variance analysis across
all technical replicates.
In addition to forward matching analysis, a decoy database was created and used for
subsequent data analysis. The same spectral library was used to create two different
decoy databases with the first decoy database created by switching precursors and
product ions. The two peptide entries used to switch must have similar retention times
but precursor m/z value differences in excess of 50 Da. The second decoy database
extended the first by further shuffling the relative abundance values per fragment ion.
Decoy hits were scored using the same acceptance criteria as that for the forward
search.
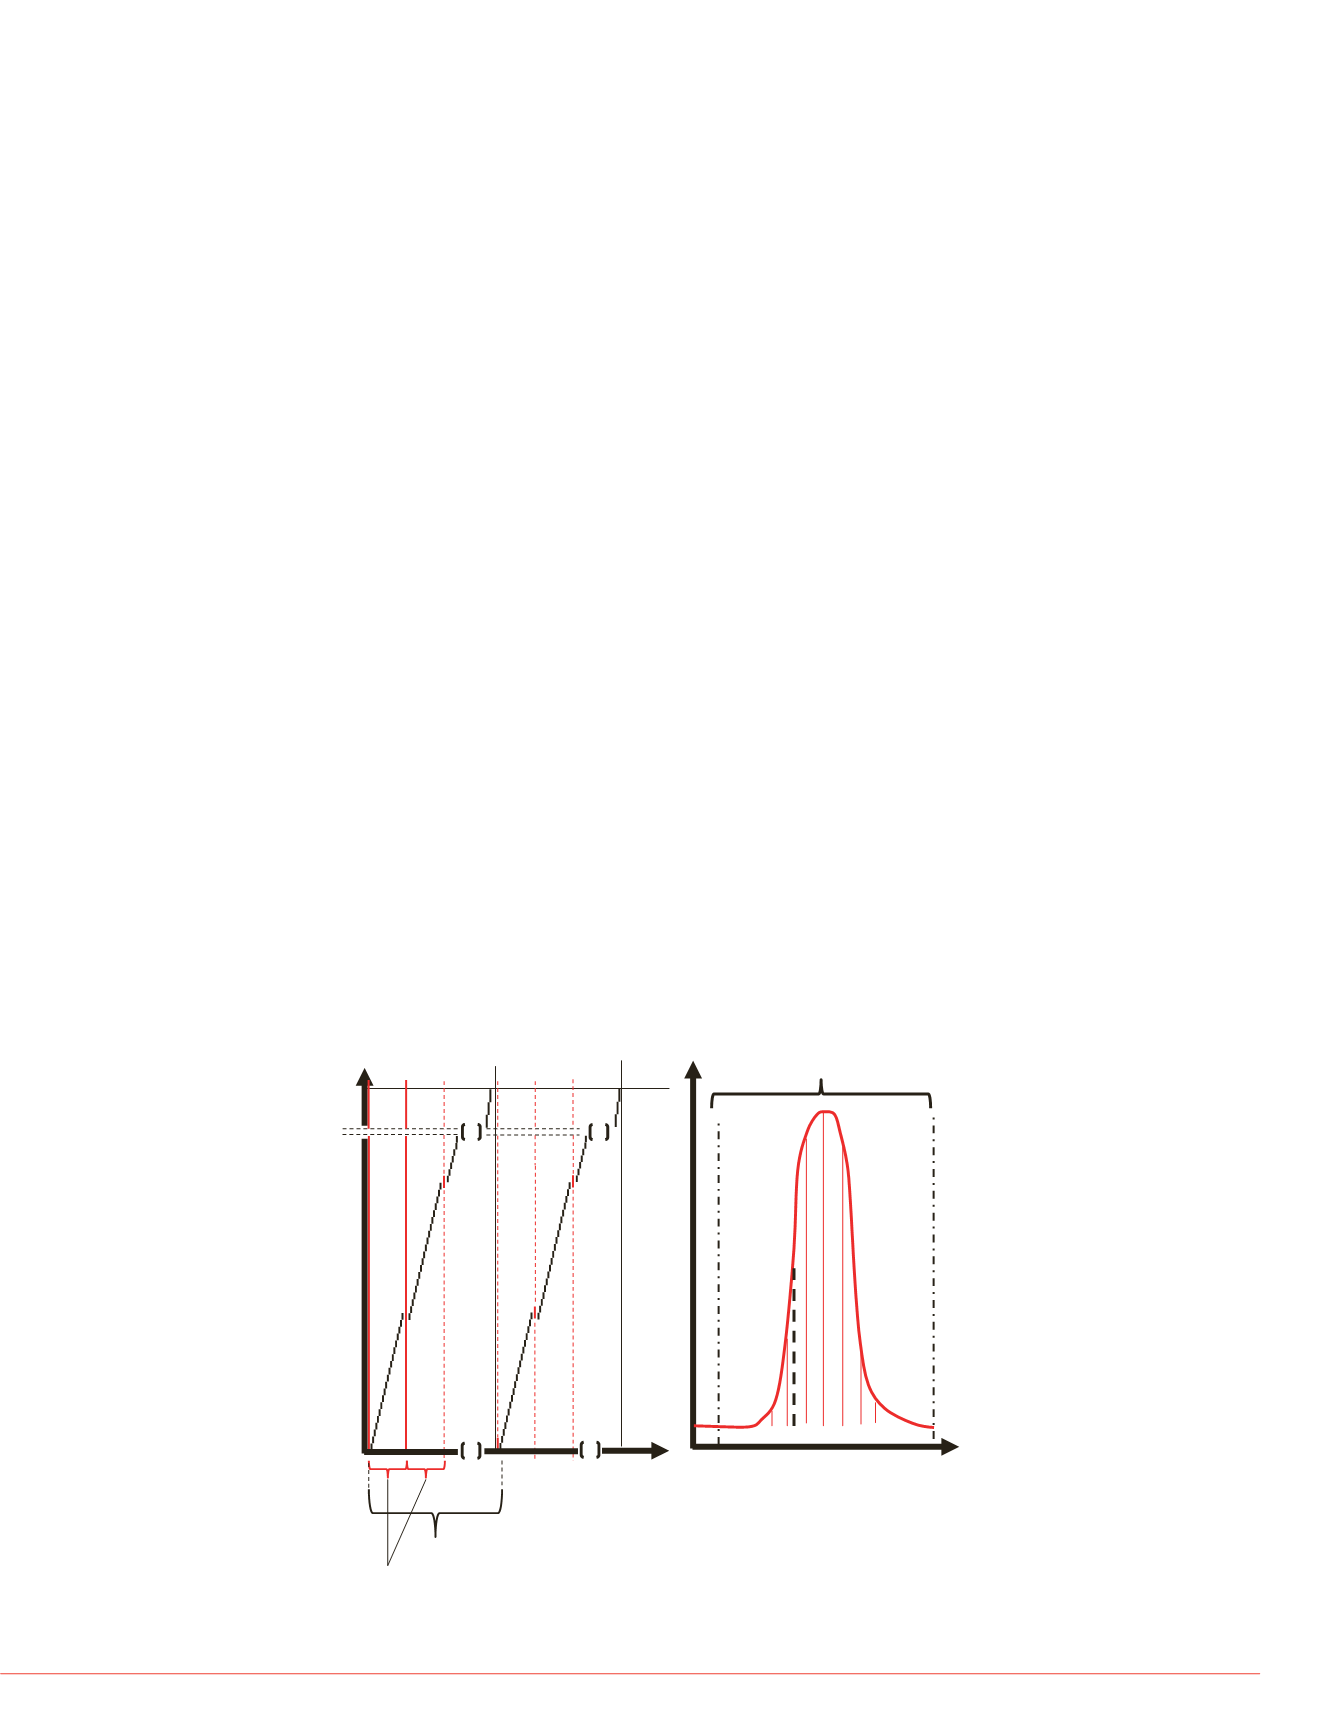
FIGURE 1. Schematic representation of pSMART data acquisition strategy
consisting of HR/AM MS spectral acquisition used for quantitative peptide
analysis
(red lines)
and looped narrow asymmetrical DIA acquisition for
qualitative peptide confirmation (black dashes). (1A) User defined loop count
dictates MS acquisition cycle time while precursor m/z range, individual DIA
precursor isolation range, and max ion fill times dictate total DIA acquisition
cycle time. The real-time data processing scheme is displayed in Fig. 1B
showing the predicted retention time window read in from the Crystal Spectral
Library, precursor XIC, and the single narrow DIA window acquired under the
precursor XIC trace.
Full Scan MS1 cycle
time
Retention Time (min)
Narrow DIA cycle time
Isolated/Filtered Precursor Mass Range
400
500
600
1200
…
…
…
…
Retention Time
MS
Expected Retention Time
32.5
33
33.5
34
Normalized Intensity
Retention Time
I
100
(8.E+06)
100
A
B
Standard
pSMART
(7.E+05)
MS1
DIA
FIGURE 2. Comparative targeted p
pSMART methods for the plasma
ion XIC results from the standard
precursor ion XIC results used to
and quantitation. The dashed line
spectrum for the targeted peptide.
distribution analysis for DIA and p
distribution read in from Crystal.
in excess of 0.7 as compared to lib
DIA is 0.87 compared to 0.81 for p
relative product ion AUC values w
used to calculate the CS score.
TABLE 1. List of comparative pepti
strategies. Each column lists the f
acceptance criteria used for proce
pSMART data (MS and DIA) was 10
experimental data are described a
Peptide
IDStrategy
Standard DIA
20ppm
6 data point
across peak
Stan
20
4 da
acro
Library Hits
2159
3
Decoy library
#1 Hits
983
1
Decoy library
#2 Hits
515
Decoy Hit
Rate (#1)
46%
5
Decoy Hit
Rate (#2)
24%
3


