
4
Real-Time Qualitative and Quantitative Global Proteomics Profiling Using a Hybrid Data Acquisition Scheme
ion strategy, experimental analysis
ed to standard DIA data. The
ribed above. In addition to spectral
ibility and quantitative capabilities
prehensive list of plasma peptides
at BRIMS over the course of two
ptides contains the sequence (with
, precursor charge states, product
n. A custom script was used to
ard DIA and pSMART data to
f identified peptides per injection.
e overlap, precursor/product ion
experimental product ion
tolerance values were set to 10 ppm
r. Standard DIA data was
es, 10 and 20 ppm and a CS score
evaluated the consecutive spectral
The final list of identified peptides
tation and variance analysis across
atabase was created and used for
ry was used to create two different
ated by switching precursors and
ch must have similar retention times
0 Da. The second decoy database
bundance values per fragment ion.
e criteria as that for the forward
Three technical replicates we
data analysis generates a list
compared across each replic
reproducibility. The peptide n
peptides identified across all t
reproducibility of peptides ide
identified across all pSMART,
another 75 peptides identified
2159 peptides from the all re
three technical replicates and
Of further interest was deter
methods as well as those pe
peptides per method were co
FIGURE 3. Venn diagram c
used to sample the plasma
technical replicates to be c
FIGURE 4. Comparative ma
SLAELGGHLDQQVEEFR th
shows the overlaid precurs
shows the isotopic distribut
matched narrow DIA windo
the PRM experiment. The in
distribution. C) shows the
experiment. The inset show
data set as compared to the
T data acquisition strategy
sed for quantitative peptide
trical DIA acquisition for
). (1A) User defined loop count
rsor m/z range, individual DIA
s dictate total DIA acquisition
me is displayed in Fig. 1B
ead in from the Crystal Spectral
IA window acquired under the
Retention Time
MS
Expected Retention Time
32.5
33
33.5
34
34.5
Normalized Intensity
Retention Time
ISASAEELR
100
(8.E+06)
100
A
B
Standard DIA
pSMART
(7.E+05)
MS1
DIA
MSMS
C
0
20
40
60
80
100
120
Normalized Intensity
m/z(ion)
0
20
40
60
80
100
Abundance
m/z
Precursor Ion Isotopic Distribution
D
Library
pSMART
DIA
Theoretical
Experimental
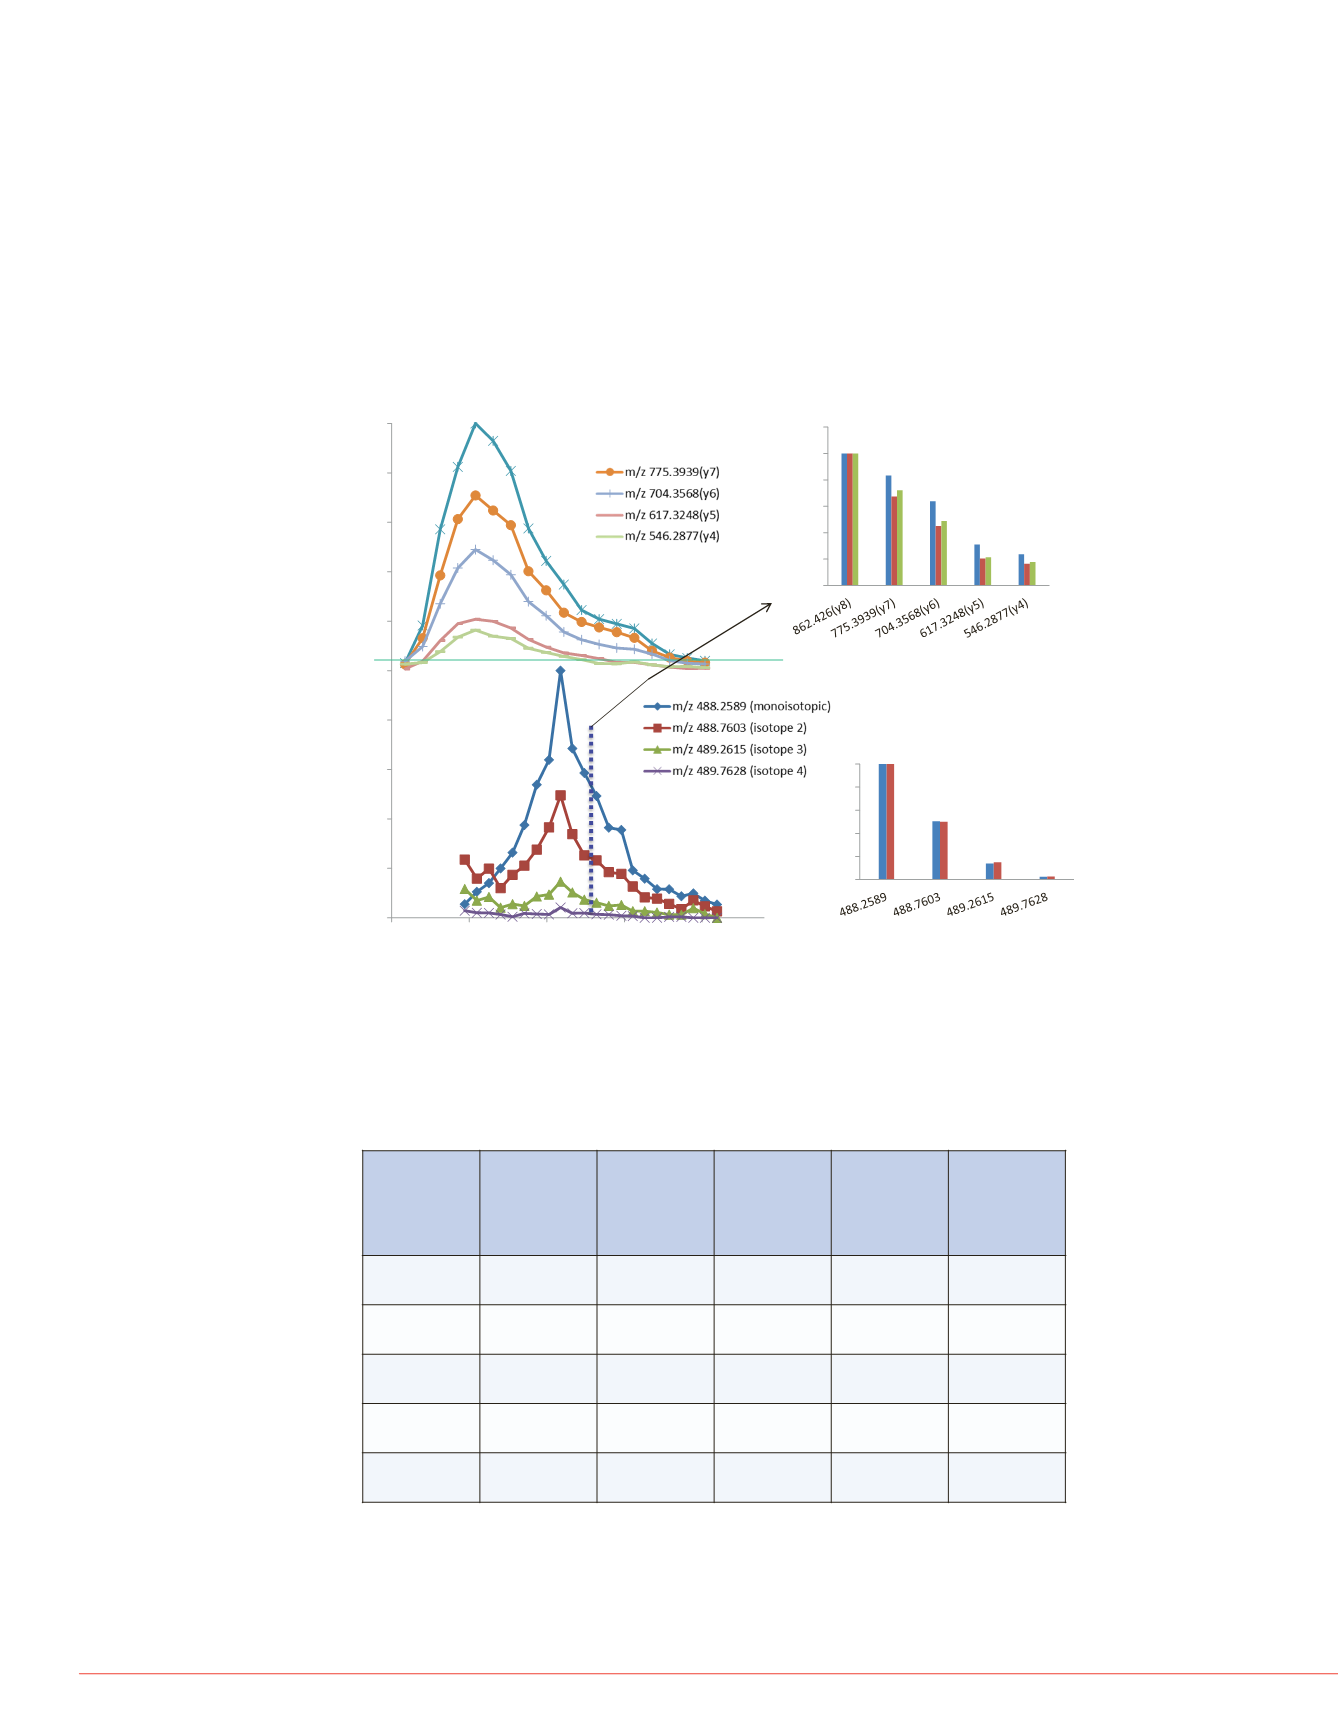
FIGURE 2. Comparative targeted peptide analysis using standard DIA and
pSMART methods for the plasma peptide ISASAEELR. (A) Shows the product
ion XIC results from the standard DIA dataset compared to (B) which shows the
precursor ion XIC results used to determine elution profile, qualitative analysis,
and quantitation. The dashed line shows the RT point for matched DIA
spectrum for the targeted peptide. Fig. C shows comparative product ion
distribution analysis for DIA and pSMART as well as the product ion
distribution read in from Crystal. Successful matching is based on CS scores
in excess of 0.7 as compared to library product ion distribution. CS scores for
DIA is 0.87 compared to 0.81 for pSMART. CS scores for DIA are based on
relative product ion AUC values whereas the single narrow DIA spectrum is
used to calculate the CS score.
TABLE 1. List of comparative peptide hits using different data processing
strategies. Each column lists the forward and decoy hit rates per data set and
acceptance criteria used for processing. Mass tolerance criteria used for
pSMART data (MS and DIA) was 10 ppm. Decoy libraries used to search
experimental data are described above.
83
84
85
0
0
100
100
pSMART
PRM
Standard D
Relative Abundance
Library
A secondary set of PRM expe
performed to target the uniqu
identified per acquisition sche
targeted inclusion list of 536 p
(standard DIA), 656 from pSM
724 peptides identified by all t
experiments as a control. Th
each PRM analysis showed o
the 724 peptides verified acro
methods were confirmed usin
85% of the peptides were con
the pSMART method, and les
of the unique peptides identifi
standard DIA were confirmed
experiment. An example of th
comparative data analysis str
presented in Figure 4.
A
B
C
Peptide
IDStrategy
Standard DIA
20ppm
6 data point
across peak
Standard DIA
20ppm
4 data point
across peak
Standard DIA
10ppM
6 data point
across peak
Standard DIA
10ppm
4 data point
across peak
pSMART
(10ppm)
Library Hits
2159
3034
1645
2244
2525
Decoy library
#1 Hits
983
1790
503
897
287
Decoy library
#2 Hits
515
996
182
363
149
Decoy Hit
Rate (#1)
46%
59%
31%
40%
11%
Decoy Hit
Rate (#2)
24%
33%
11%
16%
6%


