
5
Thermo Scientific Poster Note
•
PN-64149-ASMS-EN-0614S
Conclusion
The pSMART acquisition method f
developed to increase performanc
could be used as putative biomark
better data as compared to standa
Greater number of plasma
Significantly reduced numb
Incorporation of Crystal spe
reduce post-acquisition pro
pSMART method is easily a
different chromatographic p
References
1. Gillet, L.C., Navarro, P., Tat
Aebersold, R.,
Targeted dat
data-independent acquisitio
proteome analysis.
Molecul
2. Panchaud, A., Scherl, A., S
Miller, S. I., Goodlett, D. R.,
ocean.
Anal. Chem., 2009.
3. Lam, H., Deutsch, E., W., E
Building consensus spectral
Nature Methods, 2008.
5
(10
Three technical replicates were acquired per data acquisition scheme. The real-time
data analysis generates a list of peptide sequences per injection that can be
compared across each replicate and data acquisition scheme to determine
reproducibility. The peptide numbers listed in Table 1 sums the total number of
peptides identified across all technical replicates. Of primary interest is the
reproducibility of peptides identified across each injection. Of the 2525 peptides
identified across all pSMART, 2285 were identified in all three replicates and ca.
another 75 peptides identified in 2/3 injections. In the standard DIA identified a total
2159 peptides from the all replicates but only 1599 peptides were verified across all
three technical replicates and ca. another 180 peptides identified in 2/3 replicates.
Of further interest was determining the overlap of identified peptides across all
methods as well as those peptides uniquely identified per method. Each list of
peptides per method were compared and evaluated displayed in Figure 3.
FIGURE 3. Venn diagram comparing identified peptides per data acquisition
used to sample the plasma digest. Each peptide had to be identified in all three
technical replicates to be considered.
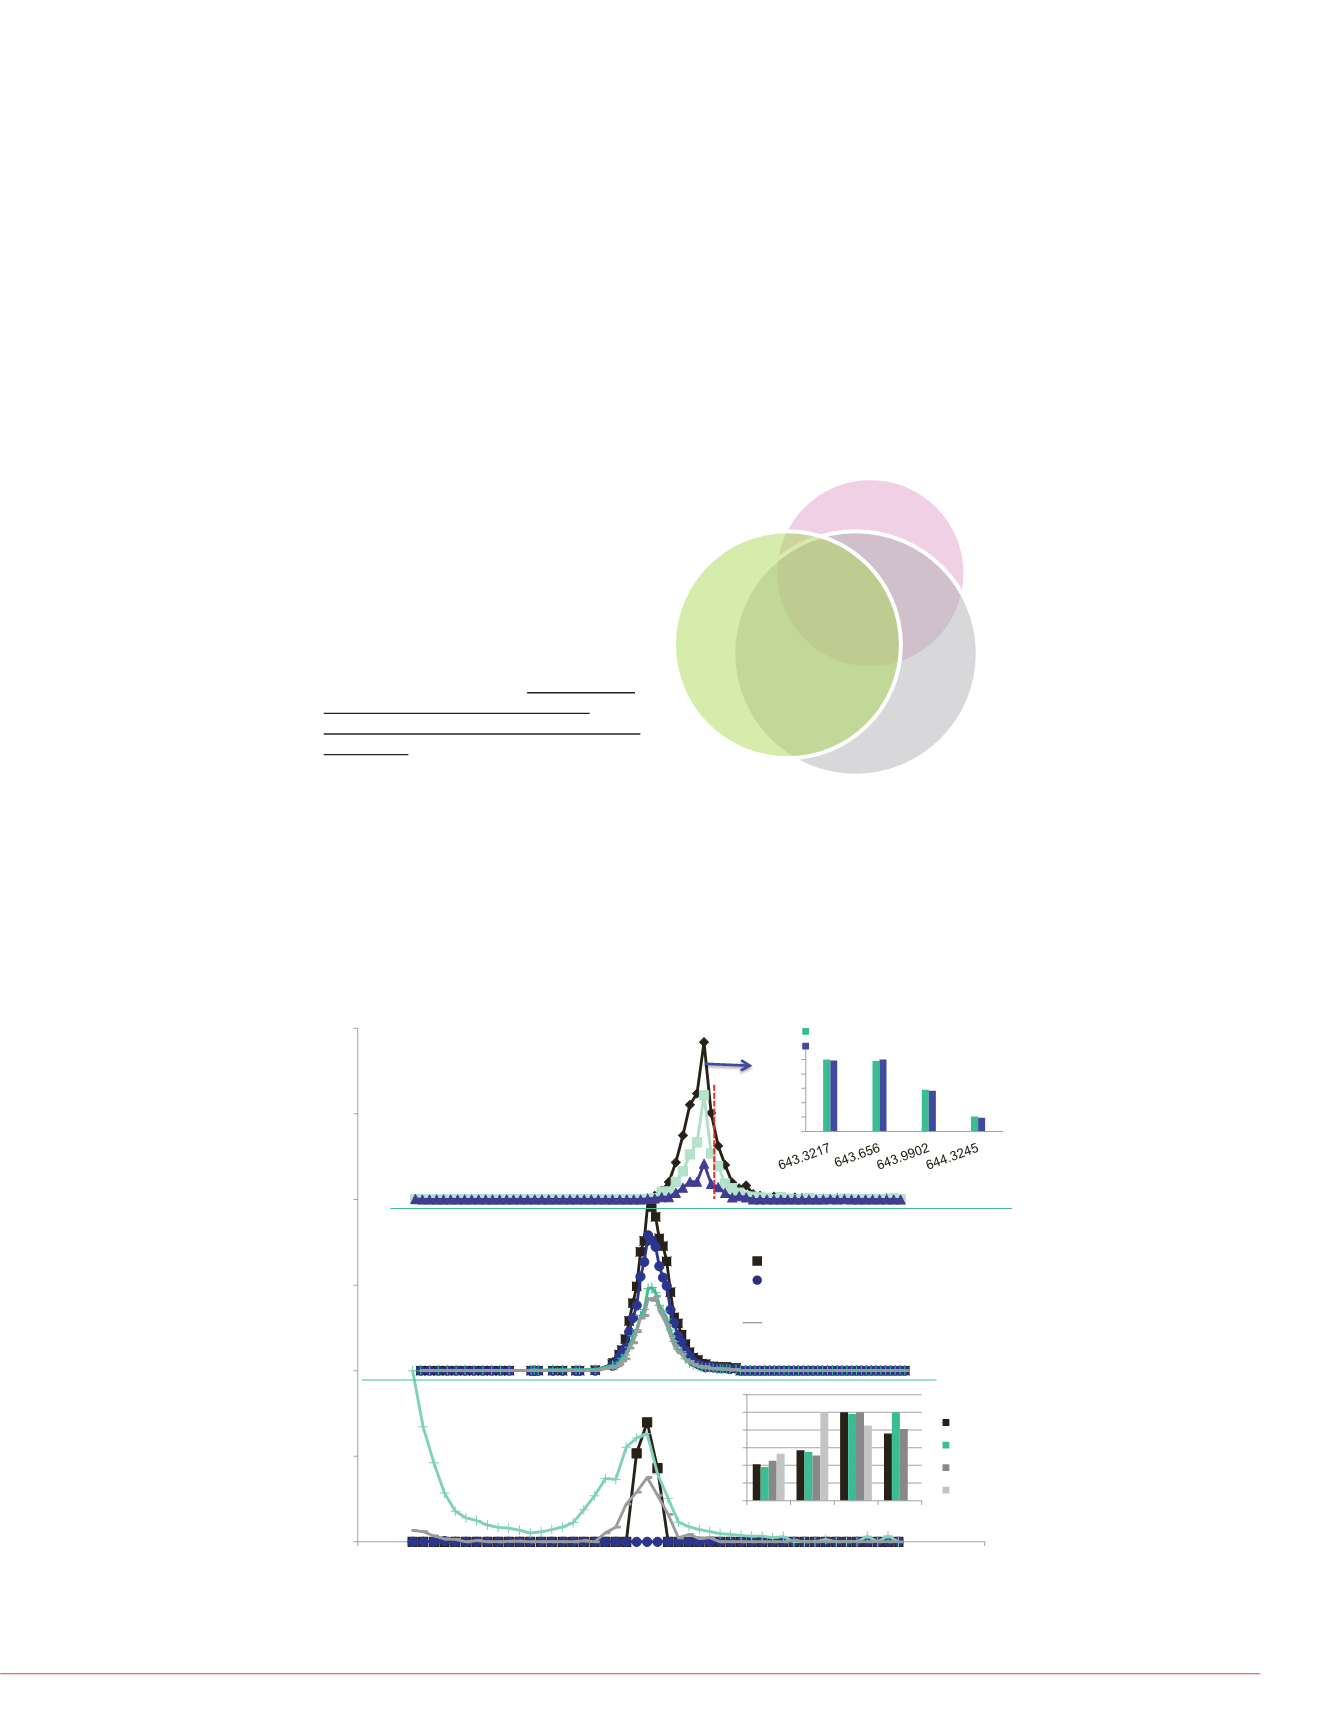
FIGURE 4. Comparative mass spectral analysis of the plasma peptide
SLAELGGHLDQQVEEFR that was uniquely identified using pSMART method. A)
shows the overlaid precursor isotopic XICs for the +3 charge state and the inset
shows the isotopic distribution overlap. The red dashed line indicates the
matched narrow DIA window. B) shows the overlaid product ion XIC trace from
the PRM experiment. The inset table list the product ions, ion type, and library
distribution. C) shows the overlaid product ion XICs from the standard DIA
experiment. The inset shows the comparative product ion distribution from each
data set as compared to the spectral library entry.
MSMS
C
0
20
40
60
80
100
120
m/z(ion)
0
20
40
60
80
100
Abundance
m/z
Precursor Ion Isotopic Distribution
D
Library
pSMART
DIA
Theoretical
Experimental
ing standard DIA and
R. (A) Shows the product
red to (B) which shows the
profile, qualitative analysis,
int for matched DIA
mparative product ion
the product ion
ing is based on CS scores
distribution. CS scores for
s for DIA are based on
narrow DIA spectrum is
erent data processing
hit rates per data set and
ance criteria used for
aries used to search
256
724
889
10
536
656
463
DDA
pSMART
DIA
83
84
85
86
87
88
89
90
0
0
100
100
0
20
40
60
80
100
120
Abundance
m/z
Theoritical Isotopic Distribution
Experimental Isotopic Distribution
MS1
pSMART
PRM
Standard DIA
Relative Abundance
Library
m/z 1050.485 (y8) 100%
m/z 1163..569 (y9) 76%
+
m/z 935.458 (y7) 57%
m/z 679.340 (y5) 48%
0
20
40
60
80
100
120
y5
y7
y8
y9
Lib.
pSMART
PRM
DIA
0.0
10.0
20.0
30.0
40.0
50.0
60.0
70.0
80.0
0-10%
11-15%
Frequency
A secondary set of PRM experiments were
performed to target the unique peptides
identified per acquisition scheme. A
targeted inclusion list of 536 peptides
(standard DIA), 656 from pSMART, and
724 peptides identified by all three
experiments as a control. The results from
each PRM analysis showed over 95% of
the 724 peptides verified across all three
methods were confirmed using PRM, over
85% of the peptides were confirmed for
the pSMART method, and less than 15%
of the unique peptides identified by
standard DIA were confirmed by the PRM
experiment. An example of the
comparative data analysis strategy is
presented in Figure 4.
A
B
C
Figure 5. Comparative reprodu
acquisition method. The coeff
three technical replicates. Are
from precursor isotopic XICs c
product ion XICs.
DIA
M
oint
eak
Standard DIA
10ppm
4 data point
across peak
pSMART
(10ppm)
2244
2525
897
287
363
149
40%
11%
16%
6%
All trademarks are the property of Thermo Fi
This information is not intended to encourag
intellectual property rights of others.


