
3
Thermo Scientific Poster Note
•
PN-64144-ASMS-EN-0614S
lobal profiling and targeted
ovel data acquisition method,
alitative and quantitative data
windows. Initial
ated the building of a detailed
r the DIA data.
eptide identifications per run
we are able to confirm MS1
ch peptide. This novel
eptides as well as novel
more targets, we were able to
ardio-dysfunction in aging
es as it ages. Aging is a
nd abilities over time and has
om the genomic-transcriptomic
nges in the heart can be
les label-free quantification of
(2 months old) and old (2
y weight, homogenized in 8M
e supernatant was then
Thermo Scientific
TM
Pierce
TM
amples was then separated by
ns. These fractions were used
ith Peptide Retention Time
erce) prior to mass
itrap Fusion
™
Tribrid
TM
mass
spray Flex
TM
Ion Source. Data
ws. Initial experiments
(DDA) for each of the
on-fractionated heart sample
el pSMART data acquisition
was run in triplicate.
and Thermo Scientific™
analyze both the qualitative
initial fractionated sample runs
firmation on all peptide targets.
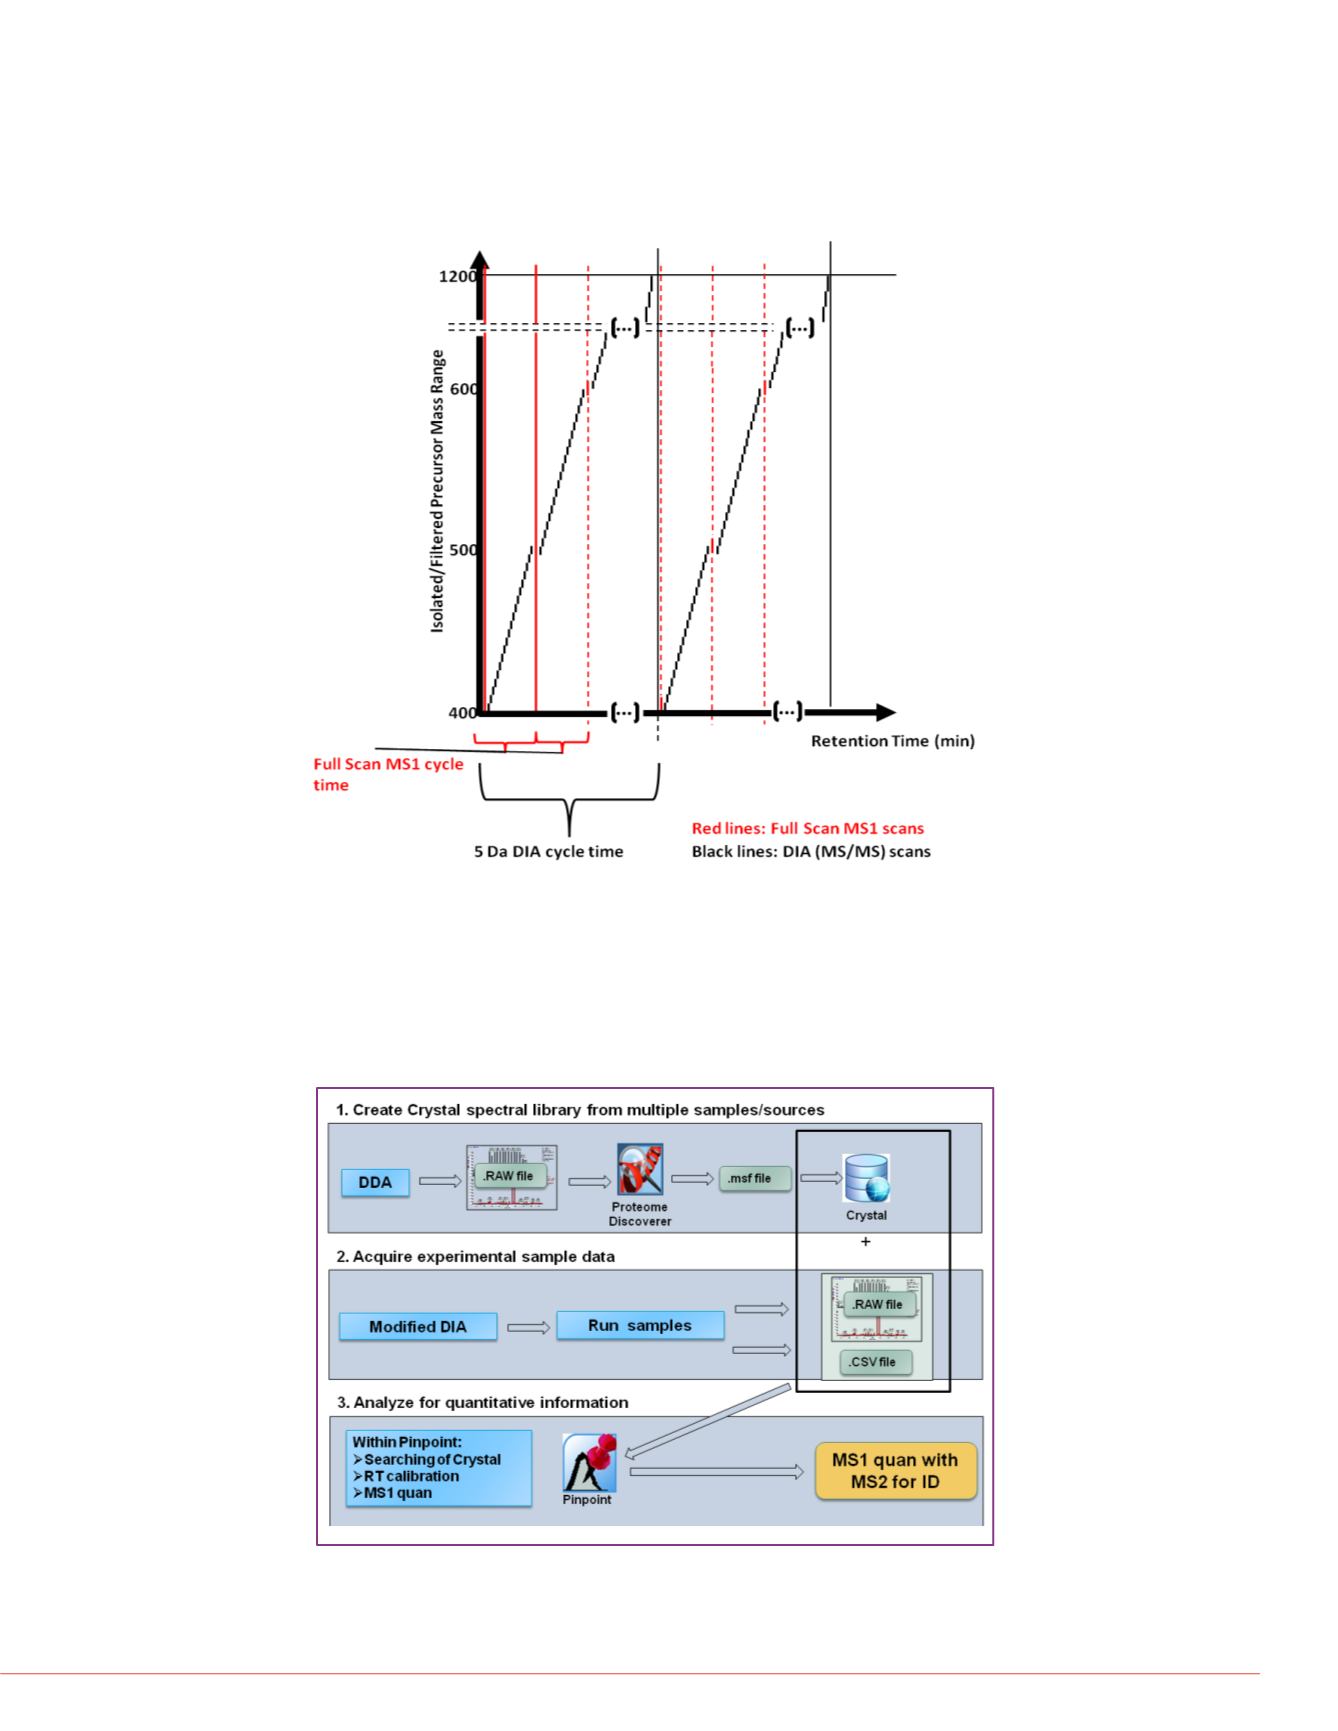
FIGURE1. pSMART data acquisition approach with high resolution accurate
mass (HR/AM) MS and 5 Da DIA acquisition. This novel acquisition method
consists of two independent loops governed by the loop count for 5 Da DIA
acquisition in between each full scan HR/AM MS spectrum. By decoupling
quantitative (fullscan MS) and qualitative (5 Da DIA) the method leverages the
most sensitive global quantitative method and the user-defined 5 Da DIA
acquisition cycle times assure at least one specific DIA window over all
precursor m/z values under study.
Results
FIGURE2. Biomarker discovery workflow using pSMART. Our workflow is a two-
step process consisting of discovery and global differential analysis. The
initial, unbiased characterization using DDA acquisition and sequencing is used
to create the spectral library (Crystal) specific for the mouse heart tissue.
Global quantitation is performed using pSMART and all data are processed in
Pinpoint. The list of peptides and corresponding retention time, precursor and
product ion information are read into Pinpoint from Crystal for automated data
processing.
FIGURE3. Quantitative differences
Relative abundance changes in pe
peak areas (DDA)(A,C,E,G) with co
composite spectra (DIA) (B,D,F,H )
and old in the triplicate data.
AnnexinA1 [Mus
Vimentin [Mus
ApolipoproteinA-IV precurso
Heat shock 70 kDa pr
A
C
E
G


