
3
Thermo Scienti c Poster Note
•
PN ASMS13_T131_APrakash_E 07/13S
ication utilizing real-time
cy over large dynamic ranges.
hnique to verify putative
es. These candidates are
eriment or derived from a
ysical interaction. These lists
teins spanning several orders of
analytical challenges for
elopment and throughput. We
) mass spectrometry (MS) and
libraries for automated method
n in real-time using novel
ight media, collected and mixed
samples were digested and
™ mass spectrometer
ired in two steps to simulate
iased data-dependent MS/MS
well as building of a spectral
ime, precursor charge state
ique verification/quantification
created from the spectral library
g real time to facilitate changes
more detail. The first step is to
. The next step is to build a list
ome from a pathway study or a
rary for this list of proteins. This
ations. This turns into a
the precursor
m/z
values for
tion time window, which are
n the presence of multiple
. Once the signal for multiple
y threshold, a higher-energy
immediately compared against
coefficient to determine
s been detected previously. If
r-defined acceptance value,
cross the elution profile. This is
Results
Highly multiplexed targeted protein
refinement prior to implementation.
straightforward based on biology, th
and corresponding
m/z
values (prec
and quantitate the peptide targets b
and acquisition windows must be d
achieve robust quantification. To ex
we have created a unique spectral l
discovery data acquisition scheme.
information that can be readily enlis
refinement steps.
To first test our methods, a protein
kit). Spectral library was first built o
on the quadrupole Orbitrap mass s
and detection schemes to not only i
data acquisition, increasing the abili
the data acquisition scheme, with M
showing the benefit of increased effi
distribution of the retention of the va
elute in the middle of the gradient.
over four acquisitions (by summing
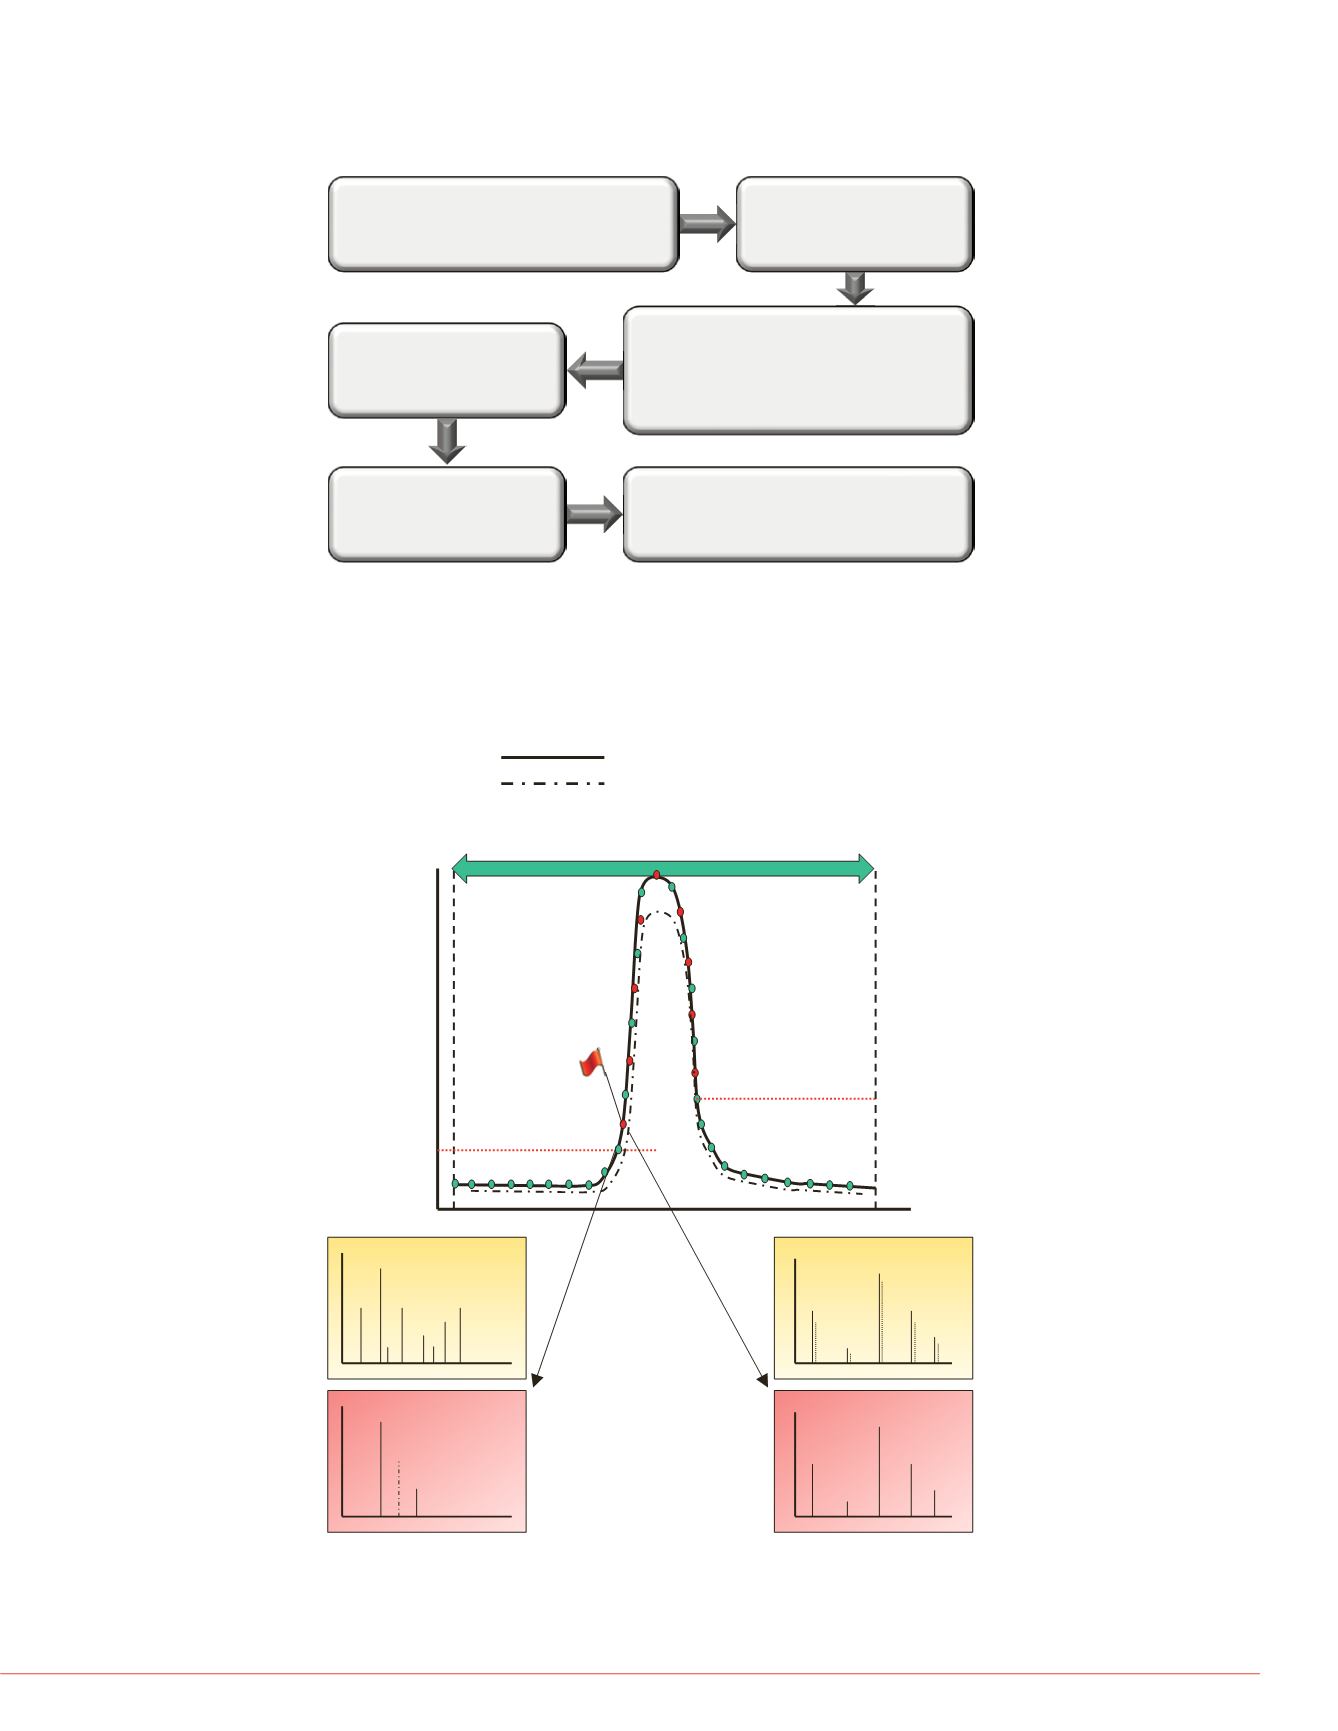
FIGURE 2. Pictorial representation of high IQ data acquisition schemes for
targeted peptide quantification using a targeted scanning window, target
elution identification, and real-time product ion spectral acquisition. Both
precursor and production spectral matching is performed to increase the
selectivity of data acquisition.
FIGURE 1. Strategy for large-scale targeted quantification based on high IQ
data acquisition scheme
*
*
Most intense isotope
2
nd
most intense isotope
Measured Ion Intensity
Retention Time (min)
Start time for “watch list”
Stop time for “watch list”
Triggering
Threshold
1.
Spectral
Library
Experimental
Spectrum
Theoretical
Isotope
Experimental
HR/AM MS
Spectrum
SDLYVSDAFHK
2.12E5
SGSAC*VDTPEEGYHAVAVVK
9.24E5
HSSFVNVHLPK
4.06E5
DGGIDPLVR
4.77E5
SSGSLLNNAIK
4.98E5
DVLMSIR
8.33E6
QTVSWAVTPK
1.75E5
EPQVYLAPHR
5.03E5
26.0 26.1 26.2 26.3 26.4 26.5 26.6 26.7 26.8
0
50
100
0
50
100
0
50
100
0
50
100
0
50
100
0
50
100
0
50
100
0
50
100
FIGURE 3. Result from high IQ da
peptides. The graphs show the M
the effective gain in duty cycle.
LC-MS characterization using the PRTC kit
to determine:
Scheduled retention time windows
Average chromatographic peak widths
Determine targeted protein list:
Discovery experiments
Pathway determination
Functional groups
Build targeted acquisition methods from spectral
libraries:
Proteotypic peptides
Optimal precursor and product ion
m/z
values
Ion distribution/relative abundance
Retention time windows
Determine targeted protein list:
Discovery experiments
Pathway determination
Functional groups
State-model data acquisition:
Real-time data interrogation
Target peptide prioritization
On-the-fly data processing
Perform relative/absolute quantification across
technical or biological replicates
Scheme


