
5
Thermo Scienti c Poster Note
•
PN ASMS13_T131_APrakash_E 07/13S
Conclusion
The developments here resulted i
over 3,000 peptides representing
digest. Successful quantification w
range and the ability to change ins
sensitivity.
ires significant steps of method
nation of proteins is relatively
tides as surrogate biomarkers
t ions) used to uniquely identify
ng. Generally, retention times
mize instrument cycle time to
perimental method development,
ased on an analytically rigorous
l library contains both LC and MS
t methods requiring few
equine plasma (containing PTRC
mixture. Experiments performed
te unique product ion collection
uisition, but perform state-model
n. Figure 3 shows the result of
uired for the various peptides,
g events. Figure 4 shows the
d as expected, most peptides
CV distribution for the peptides
ht product ions).
0
5
10
15
20
25
30
Frequency
CV% Range
27.4 27.5 27.6 27.7 27.8 27.9
heme for a small list of
the various peptides, and
FIGURE 5. CV distribution for the initial peptide list
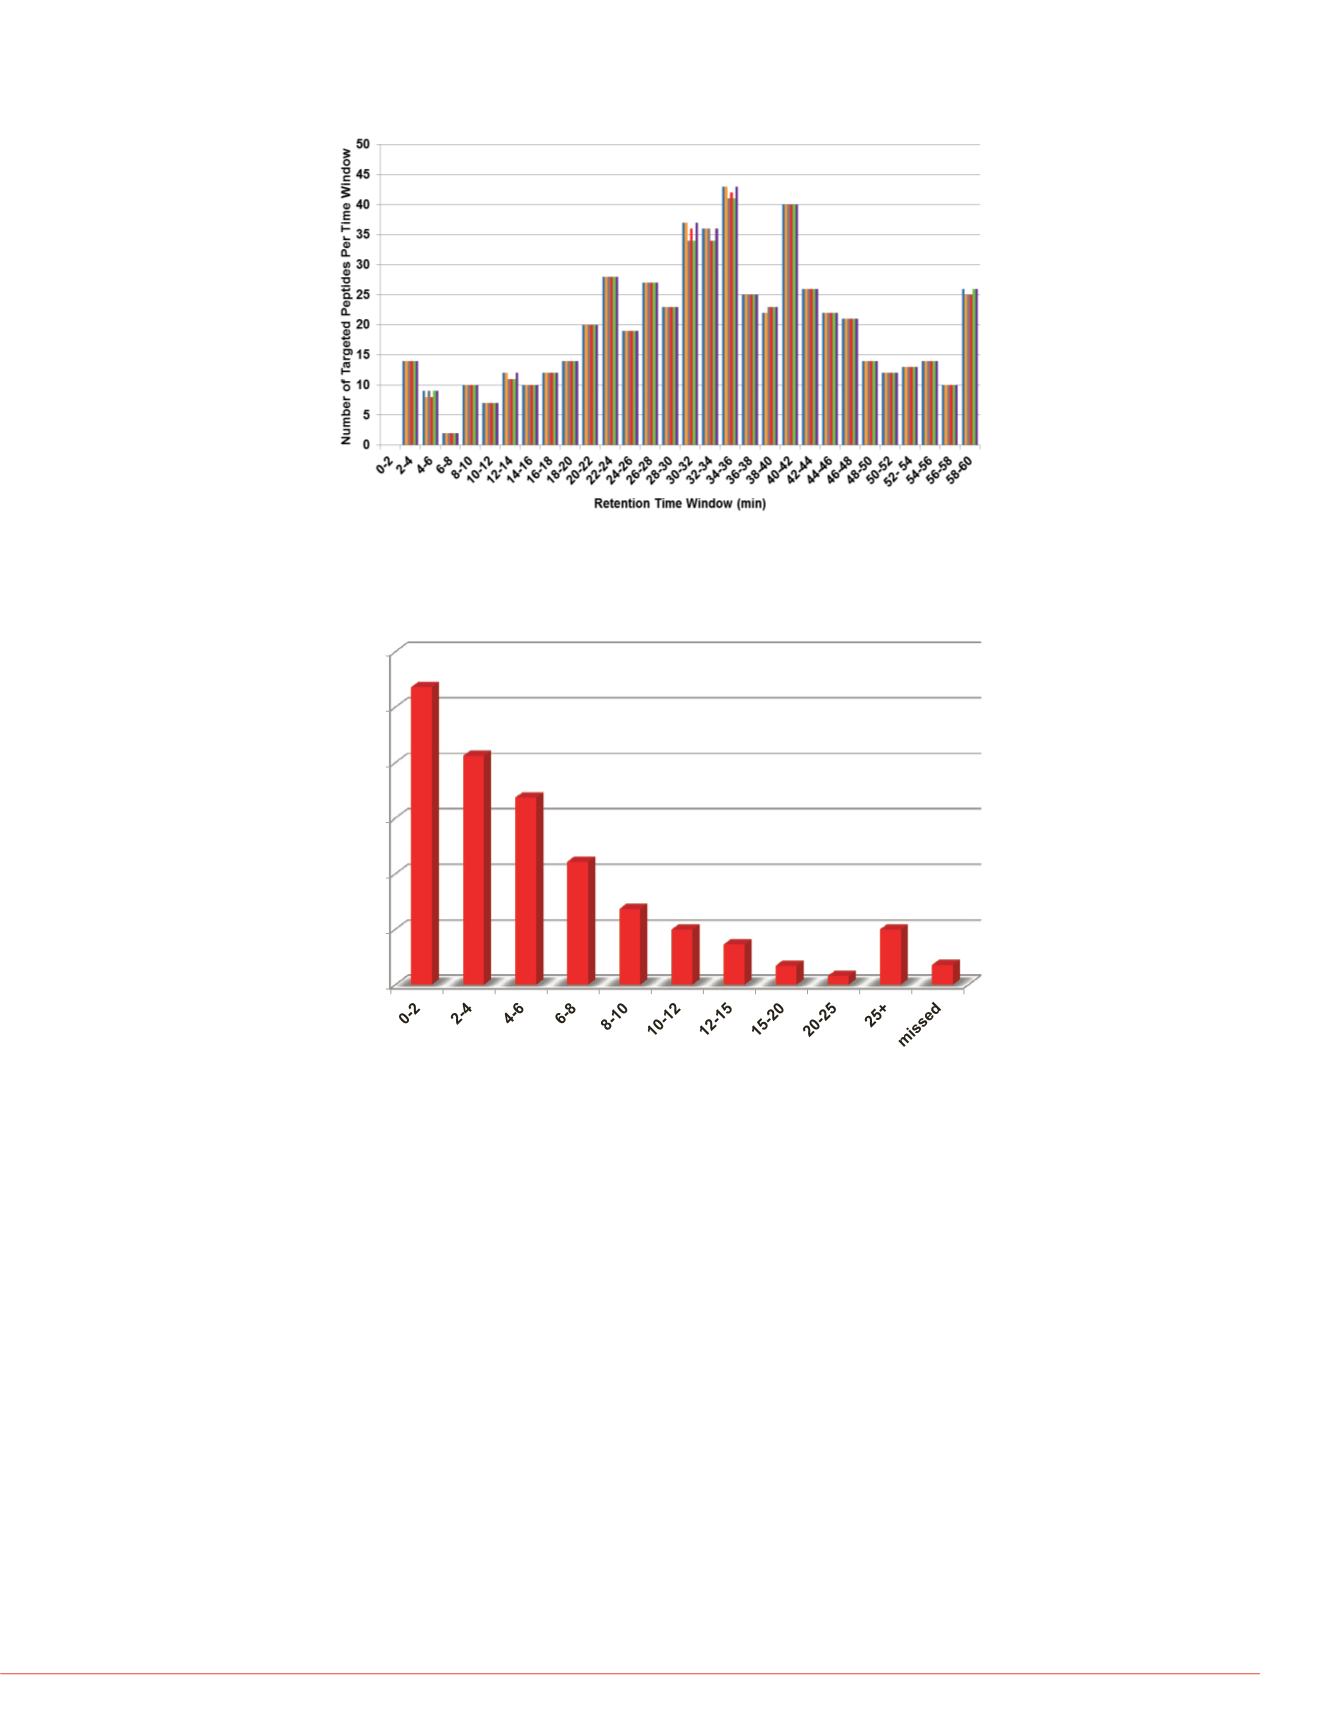
FIGURE 4. The number of targeted peptides in each retention time window
K562 Cell Line
2,100 proteins were selected from the K562 cell line and imported into the new
algorithm. The algorithm utilizes the spectral library information to select unique
peptides and create precursor and product ion information used to perform real-time
qualitative and quantitative analysis. In total, 3,800 peptides were chosen and 20-fold
range digest was created.
Figure 6 shows an example where the ratio of 1:10 could not be calculated using the
full scan MS1 (panel A), but could be calculated in tandem MS/MS scan (panel B, and
zoom-in, panel C).
FIGURE 6. The benefit of MS/MS
Ratio of 1:10 could not be calcul
calculated in tandem MS/MS sc
All trademarks are the property of Thermo Fi
This information is not intended to encourage
intellectual property rights of others.
A
Zoom in
Product ion from lig
B
C


