
3
Thermo Scientific Poster Note
•
PN-64078-ASMS-EN-0614S
titative analyses of endogenous
r research.
o Scientific™
Mass
e tips for highly-selective affinity
, verified, and quantified using
data from a
of 15 pM in plasma for all
urther, we demonstrate inter-
lted in recoveries of 96–
100%.
nical research, therapeutic
entional insulin analytical
ogenous insulin from exogenous
ortcoming
1
; however, the
manded by the field. Therefore,
red to address the complexity of
ive LC/MS detection and
arch workflow was developed
ion of insulin and its analogs
sma samples containing a mix
ded at three different amounts
p to four analogs were prepared
-quantification studies, 1.5 pM to
hosphate buffered saline.
or porcine insulin was added as
sma.
SIA workflow. Targeted
utomated Research Tip’s
e MSIA workflow was automated
handler. Following extraction,
r/acetonitrile with 0.2% formic
was adjusted to 75:25
sis.
system was used for all
a 100 x 1 mm Thermo
0–
50% in 10 min) comprised of
acetonitrile. The column was
spectrometer operated in data-
can MS data was acquired with
ass range of 800
–
2000 Da. A
and MS/MS was acquired with
used to analyze all LC/MS
nd quantitative measurement of
nalog and the six most abundant
for insulin and its analogs.
charge state distribution,
files. Product ion data was used
FIGURE 1. Targeted selection using insulin MSIA D.A.R.T.’S.. First, insulin and
its analogs are selectively bound. Then, a wash step removes background
compounds. Lastly, the insulin and insulin variants are eluted into a new plate,
which is ready for LC/MS analysis.
Results
Quantitative Measurement of In
Additional limitations to high-throu
analogs in research are inefficient
of analytical sensitivity and robust
above, we achieved an LLOQ and
plasma. Quantification curves for
and 2 display LOQ and LOD.
Further, reproducibility studies de
(Tables 3 and 4) and spike and re
In addition to the improved sensiti
background matrix. The reduced
therefore, shorter LC/MS analysis
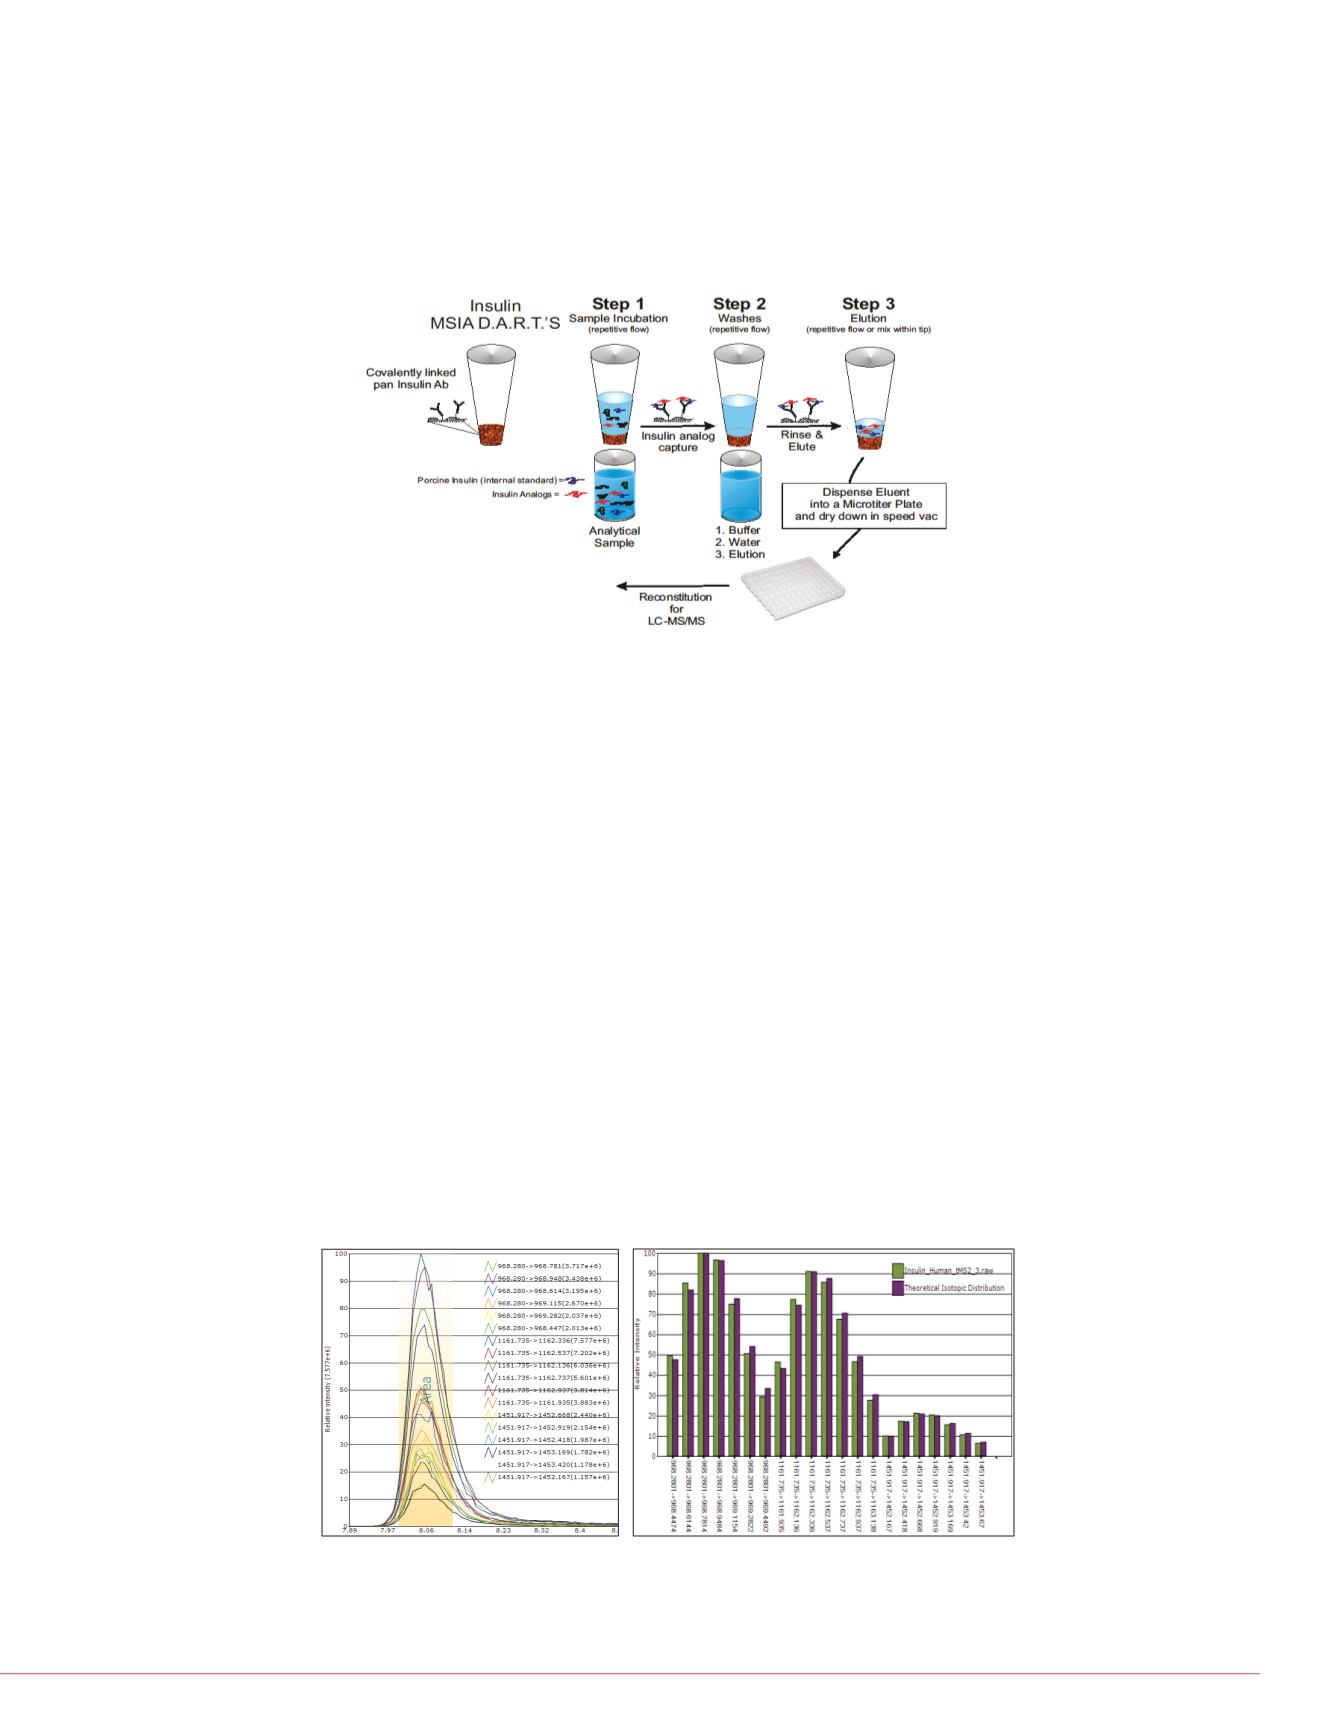
FIGURE 2. HRAM MS data analysis in Pinpoint software version 1.3. Extracted
ion chromatograms for each targeted insulin variant were created using the
isotopic
m/z
values from three precursor charge states. Integrated AUC values
from each isotope were then co-added to generate the reported values.
Additionally, each insulin variant was qualitatively scored based on
2a) comparative peak profiles (peak start and stop, apex, and tailing factors) as
well as 2b) isotopic distribution overlap.
FIGURE 4. Quantification curve
spiked into donor plasma at diff
from the donor plasma is also p
was used for each sample, the l
AUC values were normalized to
Qualitative Validation of Insulin and Its Analogs
One of the primary limitations of current insulin analytical methods is the inability to
distinguish between endogenous and exogenous insulin analogs. The immobilized
insulin pan-
antibody in the MSIA D.A.R.T.’S recognizes a common epitope region in
the
-chain that is conserved across all of the analyzed variants. This allows the
capture and detection of all variants from the sample as long as the
-chain epitope
region remains conserved. Further, utilizing full scan MS mode in the analysis stage of
the MSIA workflow enables simultaneous detection of multiple insulin analogs and the
ability to screen for unsuspected insulin analogs post-acquisition.
LC/MS detection using HRAM MS data provided the analytical selectivity to distinguish
insulin variants from the background signal using the accurate mass of multiple
precursor charge states and isotopes. Figure 2 demonstrates the HRAM data analysis
approach. Figure 3 shows simultaneous LC/MS detection of insulin variants. Further,
fragmentation patterns from data-dependent MS/MS acquisition can also be used to
confirm the identity of insulin variants (data not shown).
2a
2b
FIGURE 3. Simultaneous LC/MS
(0.48 nM), Humulin
®
S (0.06 nM),
standard were processed from t
The inset shows an enlargemen
variants. Lantus elutes 0.5 minu
700 800 900 1000 1100 1200
0
1.0
2.0
3.0
4.0
5.0
6.0
7.0
8.0
9.0
10
11
Absolute Abundance (10
5
)
[M+5H
+
]
5+
[M+6H
+
]
6+
0
2
4
6
8
10
12
14
0
100
AUCRatio
[insulin variant:porcine]
Lantus/Glulisine
Lantus
Apidra
Endogenous Insulin
For quantification, a mass tolerance of ±5 ppm was used for all data extraction.
Amounts of each insulin analog were determined by converting area-under-the-curve
(AUC) values, normalized to the AUC of the internal reference, which was calculated
from standard curve data.


