
5
Thermo Scientific Poster Note
•
PN-64075-ASMS-EN-0614S
%C
Tee
Loo
p
Flow Grad
%A
%B
-
====
out
0.50
100
-
-
T
in
0.50
100
-
-
====
in
0.50
40
60
100
====
out
0.50
25
75
100
====
out
0.50
-
100
-
====
out
0.50
100
-
duct Ions
(Q3)
Collision
Energy
S-lens
233.2
15
61
191.1
15
61
235.0
26
61
86.3
25
88
208.0
25
88
200.0
19
70
228.0
19
70
86.2
20
55
242.1
20
55
117.1
10
83
148.0
10
83
192.0
28
94
151.0
28
94
109.1
25
120
262.0
25
120
233.0
20
50
191.0
20
50
208.1
20
48
236.1
20
48
147.1
15
61
121.1
15
61
275.0
13
80
158.9
13
80
154.0
8
55
-
167.0
15
61
185.0
15
61
233.2
24
90
235.1
24
106
154.0
16
79
198.1
20
125
233.1
18
97
275.0
12
69
Results
One day of accuracy and precision measurements were performed for system verification on
each of the following analytes: amitriptyline, doxepin, imipramine, fluvoxamine,
clomipramine, fluoxetine, paroxetine, citalopram, nortriptyline, desipramine, venlafaxine,
sertraline, duloxeine, and bupropion. The inter-day and intra-day accuracy and precision
were tested from 10
–
750 ng/mL for each analyte. A summary of the results is shown in
Table 3. The assay precision had RSD values that were less than 15.0% for all compounds
tested; LOQ compounds had values less than 20.0%. Additionally, accuracy was ±15.0% of
the theoretical value for all assays. The correlation coefficient values for all compounds
ranged from 0.9900 to 0.9950, showing linearity throughout all concentrations and analytes.
All analytes passed carryover, recovery, and selectivity criteria, as well as benchtop and
autosampler stability criteria. Recoveries were all above 90.0% including matrix effects.
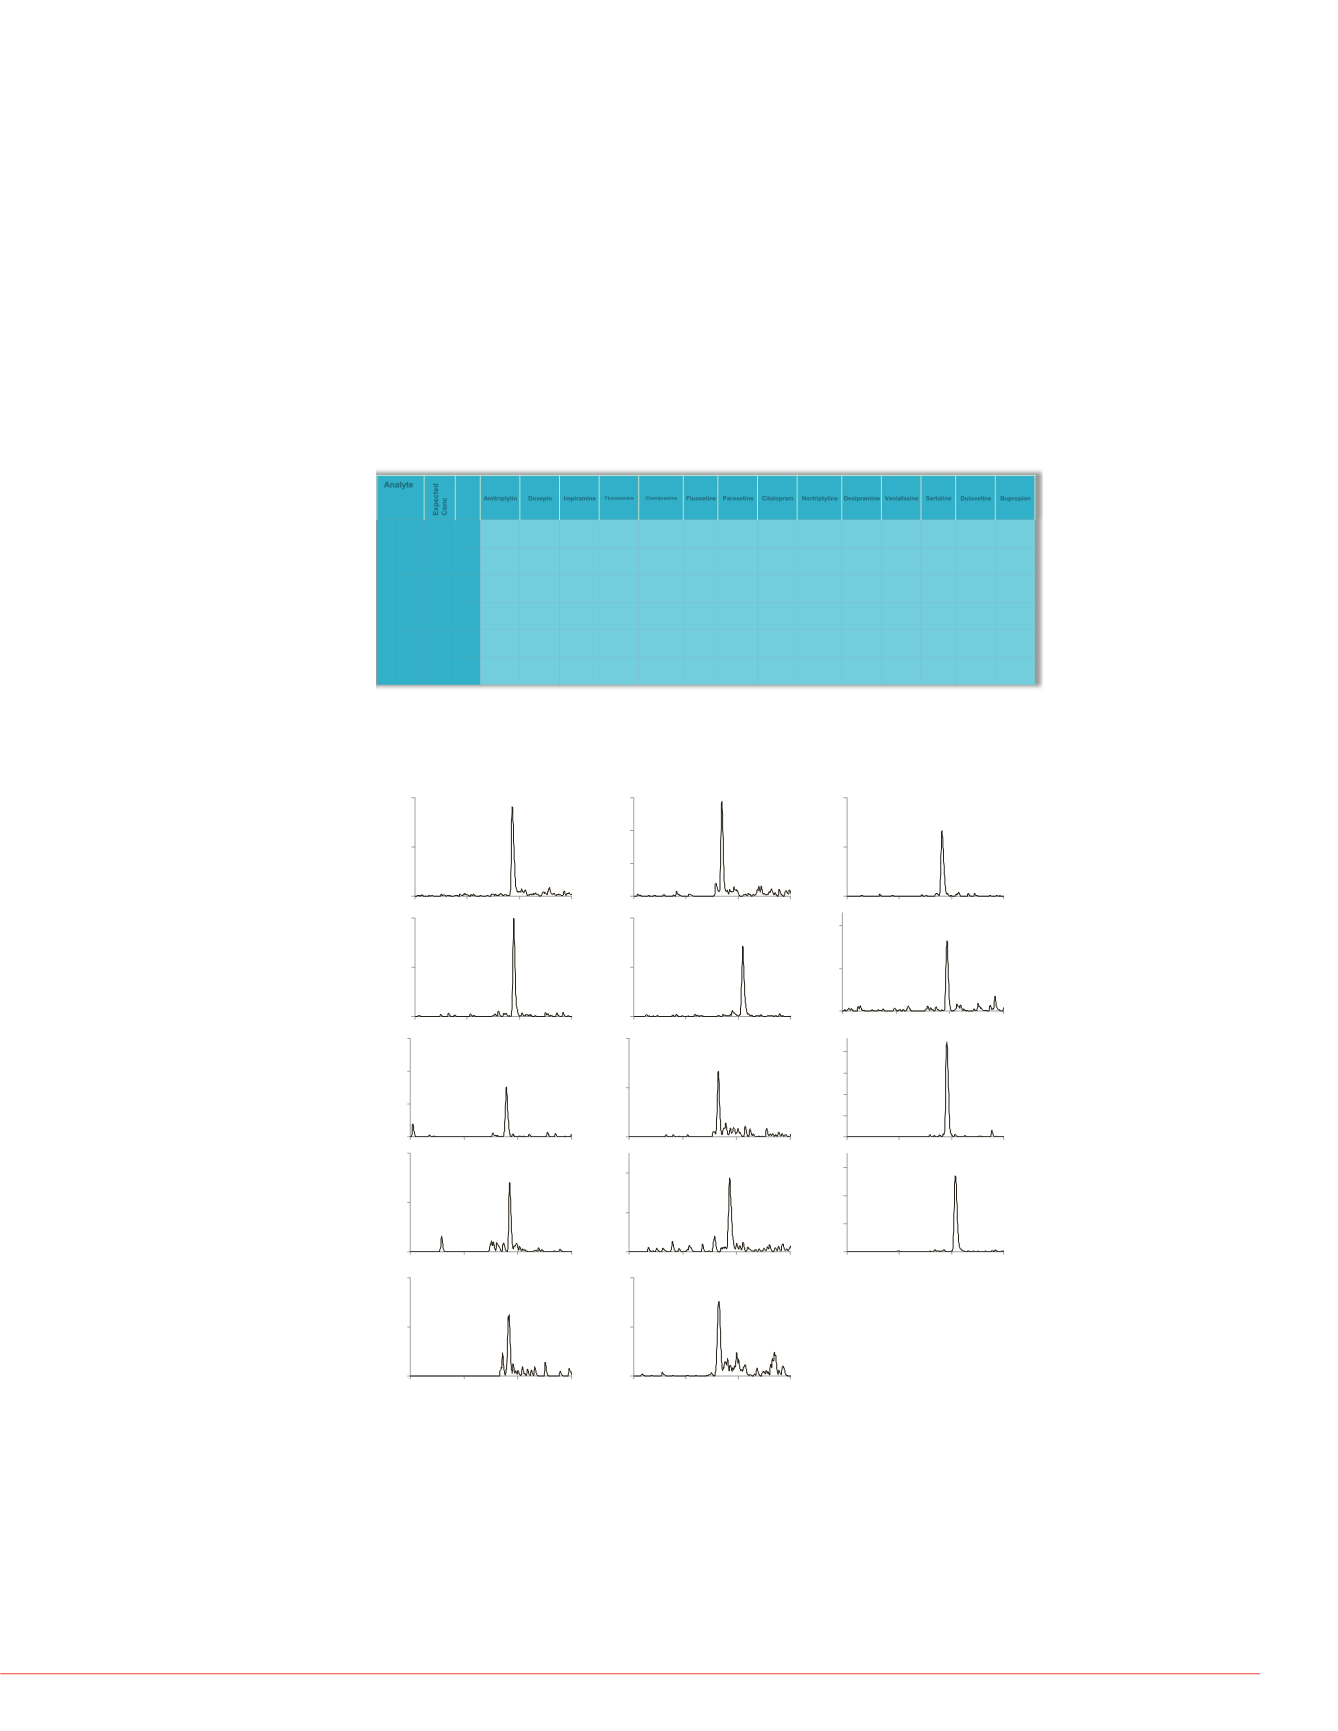
Example SRM chromatograms at the LOQ are shown in Figure 4. Examples of the
calibration curves are shown in Figure 5.
TABLE 3. Quality control accuracy and precision summary
Analyte
Expected
Conc
Amitriptylin
Doxepin
Impiramine
Fluvoxamine
Clomipramine
Fluoxetine Paroxetine Citalopram Nortriptyline Desipramine Venlafaxine Sertaline Duloxetine Bupropion
Level
Low
20
AVG
17.6
18.0
19.9
19.6
19.3
17.6
18.2
18.9
18.4
19.4
21.4
19.1
18.9
17.3
%RSD
12.25
10.25
0.20
2.00
3.70
12.25
9.28
5.38
7.88
3.20
7.00
4.75
5.70
13.70
Mid
110
AVG
113
98
115
125
116
118
115
115
116
111
114
17
117
118
%RSD
3.14
11.18
4.29
8.87
5.82
7.09
4.18
4.73
5.64
0.91
4.00
6.00
1.91
2.44
High
380
AVG
399
336
409
423
411
418
394
391
409
391
401
415
389
375
%RSD
4.95
11.36
7.58
11.26
8.05
10.05
3.68
2.89
7.58
2.95
5.42
9.16
2.42
1.27
FIGURE 4. Representative chromatograms at the LOQ
0
250
500
0
1
2
3
0
300
600
0
1
2
3
0
1000
2000
3000
0
1
2
3
0
250
500
750
0
1
2
3
0
325
650
975
1300
0
1
2
3
0
500
1000
0
1
2
3
0
1000
2000
0
1
2
3
0
325
650
0
1
2
3
0
1500
3000
0
1
2
3
0
500
1000
1500
0
1
2
3
0
750
1500
0
1
2
3
Amitriptylin
Doxepin
impiramine
Fluvoxamine
Clomipramine
Fluoxetine
Paroxetine
Citalopram
Nortriptyline
Desipramine
Venlafaxine
Sertraline
Duloxetine
Bupropion
0
400
800
0
1
2
3
0
200
400
0
1
2
3
0
600
1200
0
1
2
3
FIGURE 5. Representative calibr
Conclusion
•
An LC-MC/MS research method h
quantification of 14 antidepressant
system and a TSQ Endura triple qu
•
Online sample cleanup of the matr
complexity of the LC-MS/MS wor
•
Due to the use of online sample pr
perform, takes less time, is more r
preparation such as SPE plates.
For Research Use
Whatman is a registered trademark
Thermo Fis
This information is not intended to e
infringe the i


