
3
Thermo Scientific Poster Note
•
PN-60477-ASMS-EN-0614S
containing a panel of 19 opiates
ompounds were analyzed using
matographic separation coupled
pole mass spectrometer.
e, diluted, and injected onto the
ific™ Accucore™
aQ analytical
mpounds were simultaneously
ctrospray ionization (HESI-II)
proximately four minutes,
internal standards.
were verified successfully and
e analyzed without hydrolysis,
tories to analyze opiates and
is process can take up to
s are converted back to their
es these time constraints,
metabolites. Such metabolites
n for being difficult to
PLC system equipped with an
tes and resolution of isobars.
ects the low end of the
s and provides accurate
nds.
at various concentrations to
ed into two parts; one set was
nalyzed directly. Hydrolysis was
ntaining
b
-glucuronidase to
drolyzed samples had the same
t any
b
-glucuronidase present
rds were then added to all the
. The supernatant was removed
S/MS analysis.
ystem, seen in Figure 1, was
m particle size Accucore aQ
% formic acid in (A) water and
ction, the LC system was able to
method. The total method time
2 min for all 19 compounds.
TABLE 2. Accuracy and precisio
1.0
1.5 2.0
2.5 3.0
3.5
4.0
Time (min)
0
20
40
60
80
100
Relative Abundance
0
20
40
60
80
100
Relative Abundance
0
20
40
60
80
100
Relative Abundance
0
20
40
60
80
100
Relative Abundance
0
20
40
60
80
100
Relative Abundance
2.50
2.81
1.86 2.24
2.23
2.81
2.50
1.86
2.69
2.45
2.16
2.42
2.70
2.42
2.69
2.15
1.0
0
20
40
60
80
100
0
20
40
60
80
100
0
20
40
60
80
100
Relative Abundance
0
20
40
60
80
100
Morphine (1.86)
Norcodeine (2.50)
Norhydrocodone
(2.81)
Hydromorphone
(2.23)
Codeine (2.45)
Hydrocodone
(2.69)
Oxymorphone
(2.16)
Noroxycodone
(2.70)
Dihydrocodeine
(2.42)
6
Analyte
Normorphine
Dihydromorphine
Morphine
Oxymorphone
Hydromorphone
Norcodeine
Dihydrocodeine
Codeine
Norhydrocodone
Oxycodone
Noroxycodone
Hydrocodone
6-Acetylmorphine
Codeine-6
b
-glucuronide
Oxymorphone-3
b
-glucuronide
Hydromorphone-3
b
-glucuronide
Morphine-3
b
-glucuronide
Morphine-6
b
-glucuronide
6-Acetylcodeine
Grad
%A
%B
Step
100.0
-
Step
92.0
8.0
Step
92.0
8.0
Step
75.0
25.0
amp
65.0
35.0
Step
-
100.0
Step
100.0
-
method, including solvent
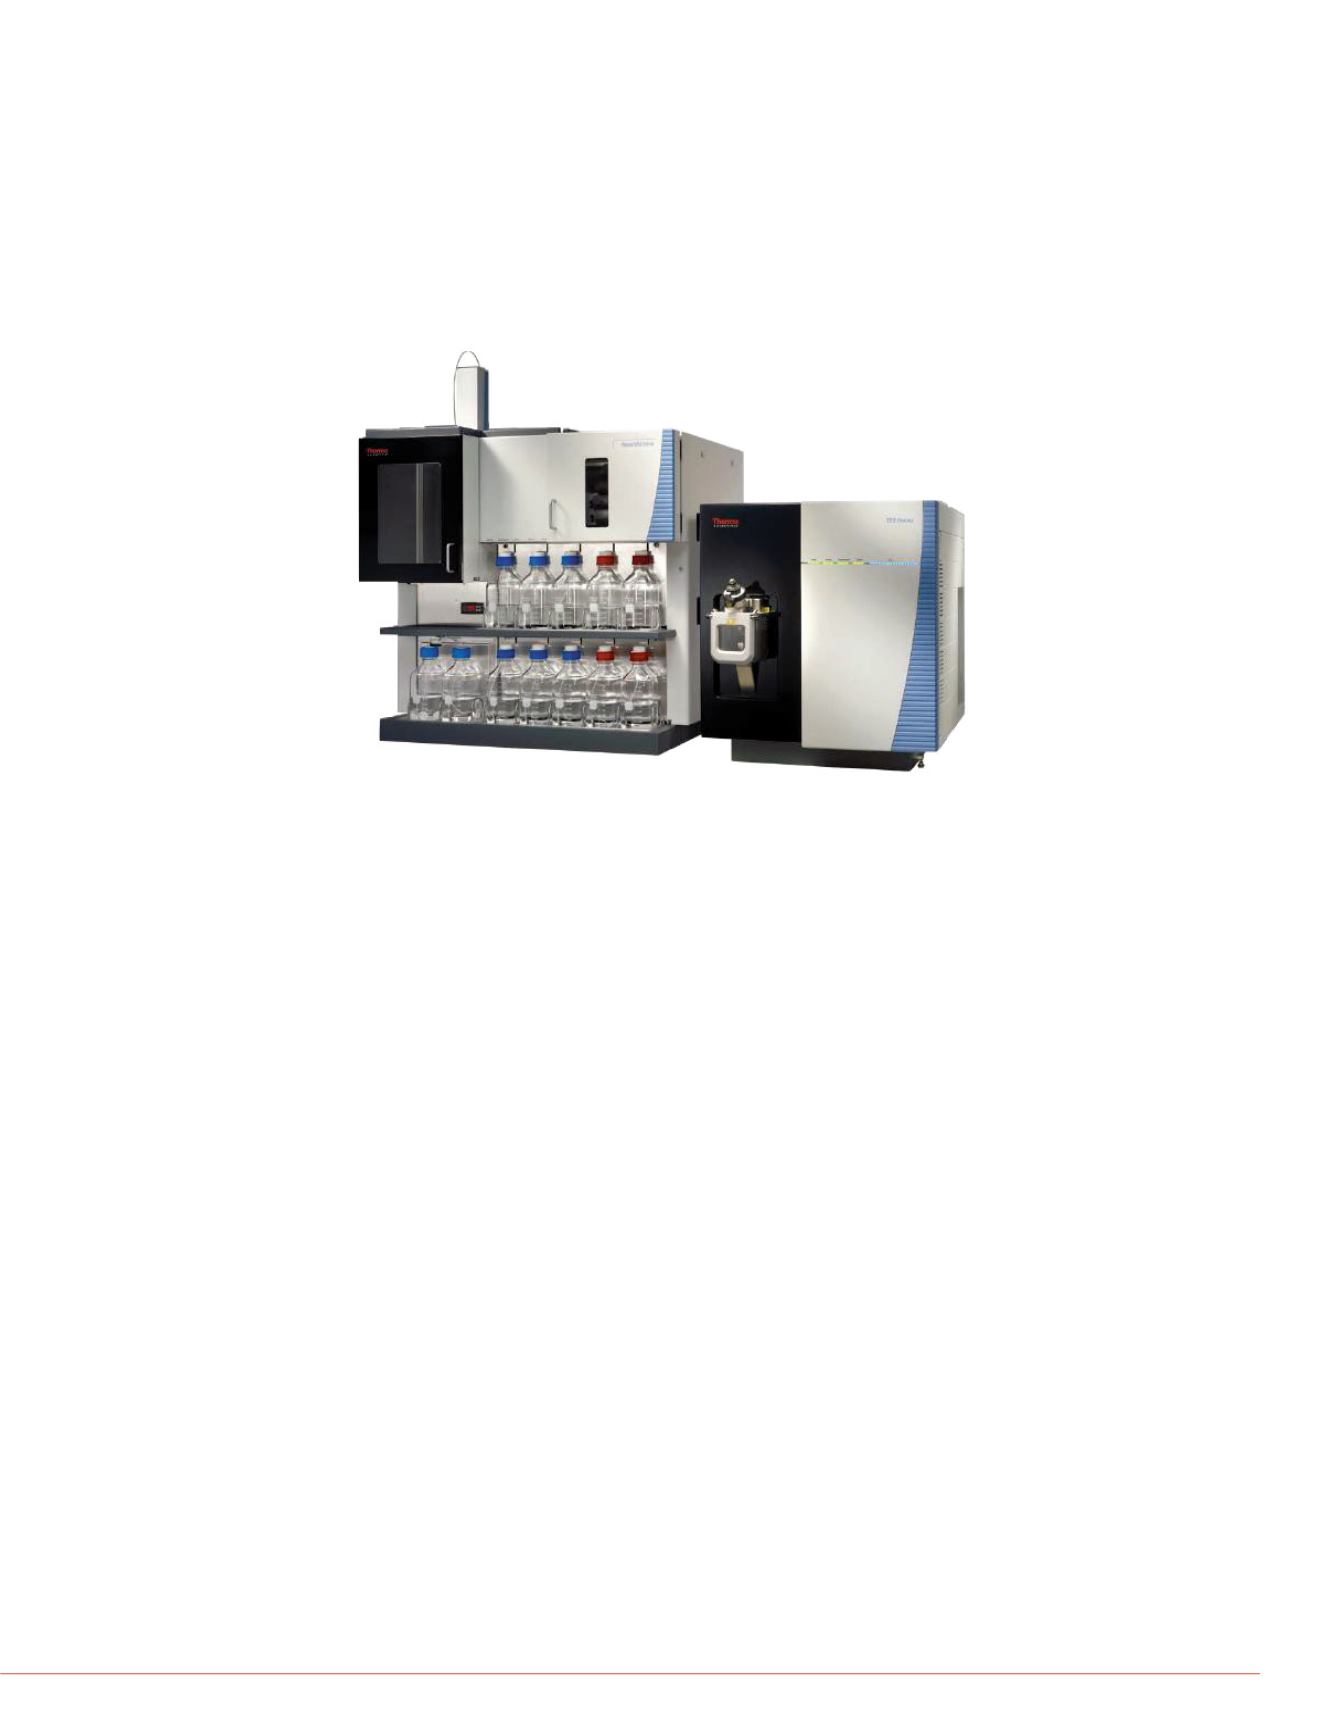
FIGURE 1. Prelude SPLC system (left) and TSQ Endura MS (right)
Mass Spectrometry
A TSQ Endura triple quadrupole mass spectrometer with a HESI-II ionization probe in
positive mode was used as the detector.
Data Analysis
All data acquisition and quantification for this method was performed using Thermo
Scientific™ Aria™ MX software version 2.1 and Thermo Scientific™ TraceFinder™
software version 3.1.
FIGURE 2. Lower limit of quantit
Results
Calibration standards containing all 19 compounds at a concentration range of
5
–
500 ng/mL were prepared in human urine. Quality control (QC) samples were also
prepared in urine at three levels: 12, 225, and 400 ng/mL. Accuracy and precision were
tested by using five replicates of three levels of quality controls over four days and
quantitating them using calibration curves at the beginning and end of the batch run.
Carryover was calculated by dividing the total analyte signal of the lower limit of
quantitation (LLOQ) by the total analyte signal found in the matrix blank after the upper
limit of quantitation (ULOQ). This number could not exceed 20% of the total LLOQ
signal. Additionally, autosampler stability (24 hours at 4
°
C) was determined by running
QC samples that were refrigerated overnight in the autosampler and comparing them
to a freshly prepared calibration curve the following day.
The assay precision had %RSD values that were within 15.0% for all QC and
calibration standard levels. Additionally, accuracy was within 15.0% for all QC and
calibrations standard levels. All of these results are shown in Table 2. All of the analytes
passed acceptance criteria for carryover and autosampler stability. Example
chromatograms at the lower limit of quantitation for each of the compounds are shown
in Figure 2. Additionally, representative calibration curves are shown for two
glucuronides in Figure 3. The R
2
value for morphine-6
b
-glucuronide was 0.9982 and
for oxymorphone-3
b
-glucuronide was 0.9978. For all compounds within this method,
R
2
> 0.9900.
Lastly, all mass spectrometer transitions and parameters are shown in Table 3 Both
the Thermo Scientific™ TSQ Vantage™ MS and TSQ Endura MS used the same
transitions and parameters. Switching between these two different quadrupole mass
spectrometers required no method changes, allowing for ease of use and quick
analysis.


