
6
Verification of an LC-MS/MS Forensic Method for 19 Opioids, Opiates, and Their Metabolites in Human Urine Without Hydrolysis
For forensic use only.
All trademarks are the property of Thermo Fisher Scientific and its subsidiaries.
This information is not intended to encourage use of these products in any manners that might infringe the
intellectual property rights of others.
pounds
Product
Ions (Q3)
CE
(V)
S-lens
(V)
165.0
59
95
209.0
40
95
286.1
52
148
185.2
58
139
284.1
47
147
302.1
42
147
185.2
58
139
286.1
52
148
286.1
52
148
185.2
58
139
300.2
31
114
215.2
39
114
165.0
58
112
211.0
39
112
225.1
27
109
165.1
47
109
185.1
48
95
165.0
59
95
165.1
64
90
185.0
44
119
227.0
40
116
199.1
55
116
185.0
44
119
165.1
64
90
171.0
40
119
199.1
43
119
201.1
42
93
199.0
52
93
165.1
64
90
181.6
49
90
241.1
41
119
256.0
40
119
227.0
41
116
187.0
40
116
199.0
39
119
241.1
35
119
171.1
40
119
181.1
51
94
190.1
25
116
152.1
62
116
165.1
38
116
289.1
32
140
152.1
61
116
202.1
34
116
165.1
43
116
185.1
32
116
289.1
31
140
218.1
43
116
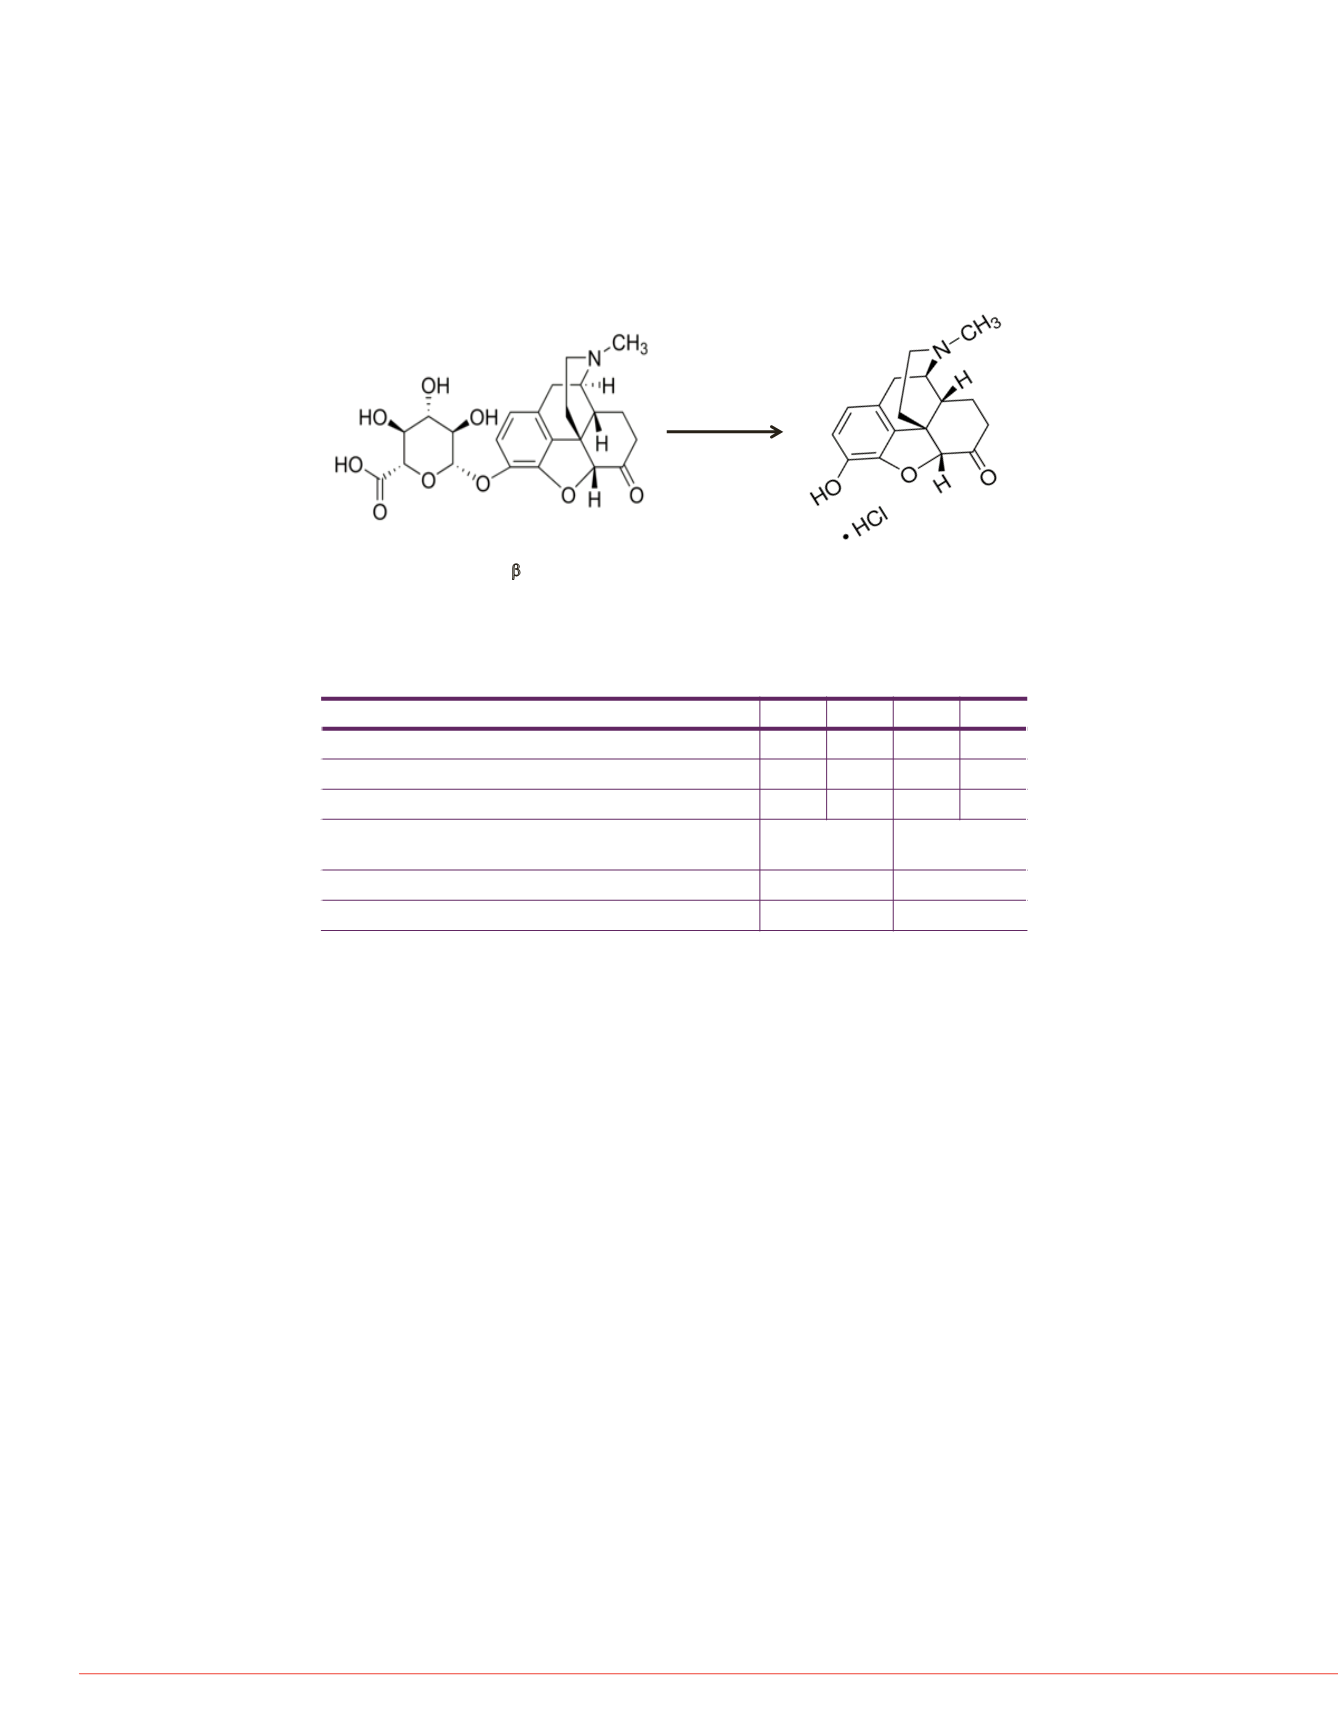
FIGURE 4. Molecular structures of hydromorphone glucuronide (H3G) and
hydromorphone (H)
β
-glucuronidase
Hydromorphone-3
b
D-glucuronide (mw 461)
Hydromorphone (mw 285)
Conclusion
This quantitative method shows that accurate, efficient analysis of opioids, opiates,
and their metabolites without hydrolysis is possible.
Verification of a forensic method for opioids, opiates, and their metabolites on a
Prelude SPLC system and a TSQ Endura MS shows that the LC and MS systems
can analyze these problematic compounds reproducibly.
This forensic method is more accurate, easier to perform, takes less time, and is
less costly then those that require hydrolysis because the sample preparation is
eliminated from the workflow.
The Prelude SPLC system with an Accucore aQ analytical column provides the
necessary chromatography, while the TSQ Endura MS allows for sensitive detection
of all compounds.
morphone-3
b
-
uronide
oncentration (ng/mL)
ntact glucuronides
Figure 4 displays molecular structures for hydromorphone glucuronide and
hydromorphone. The starting structure shows the sugar attached to the parent
molecule, which exists before hydrolysis is performed. The method in this poster
analyzes this structure as a whole, instead of converting it back to the parent.
Table 4 shows the results of a comparison done between hydrolyzed and
nonhydrolyzed samples. Analyzing the intact metabolite gives equally as accurate
results as does analyzing the parent.
TABLE 4. Comparison of hydromorphone glucuronide (H3G) and hydromorphone (H)
concentration from hydrolyzed and nonhydrolyzed samples
H3G
H3G
H
H
Prepared concentration (ng/mL)
20
100
20
100
Measured concentration prior to hydrolysis (ng/mL)
18.6
112.4
0
0
Measured concentration after hydrolysis (ng/mL)
0
0
12.4
64.2
Expected % converted to parent based on molecular
weight (285/461=62)
62
62
Actual % measured based on results
66
57
% Difference
6.3
8.4


