
4
Verification of an LC-MS/MS Forensic Method for 19 Opioids, Opiates, and Their Metabolites in Human Urine Without Hydrolysis
TABLE 2. Accuracy and precision data for all 19 compounds
TABLE 3. Transitions and
1.0
1.5 2.0
2.5 3.0
3.5
4.0
Time (min)
0
20
40
60
80
100
Relative Abundance
0
20
40
60
80
100
Relative Abundance
0
20
40
60
80
100
Relative Abundance
0
20
40
60
80
100
Relative Abundance
0
20
40
60
80
100
Relative Abundance
2.50
2.81
1.86 2.24
2.23
2.81
2.50
1.86
2.69
2.45
2.16
2.42
2.70
2.42
2.69
2.15
1.0 1.5 2.0 2.5 3.0 3.5 4.0
Time (min)
0
20
40
60
80
100
0
20
40
60
80
100
0
20
40
60
80
100
Relative Abundance
0
20
40
60
80
100
2.59
1.70
4.14
0.5
1.0
1.5
2.0
2.5
3.0
Time (min)
0
20
40
60
80
100
0
20
40
60
80
100
0
20
40
60
80
100
Relative Abundance
0
20
40
60
80
100
1.65
1.47
1.79
1.65
1.46
1.79
2.38
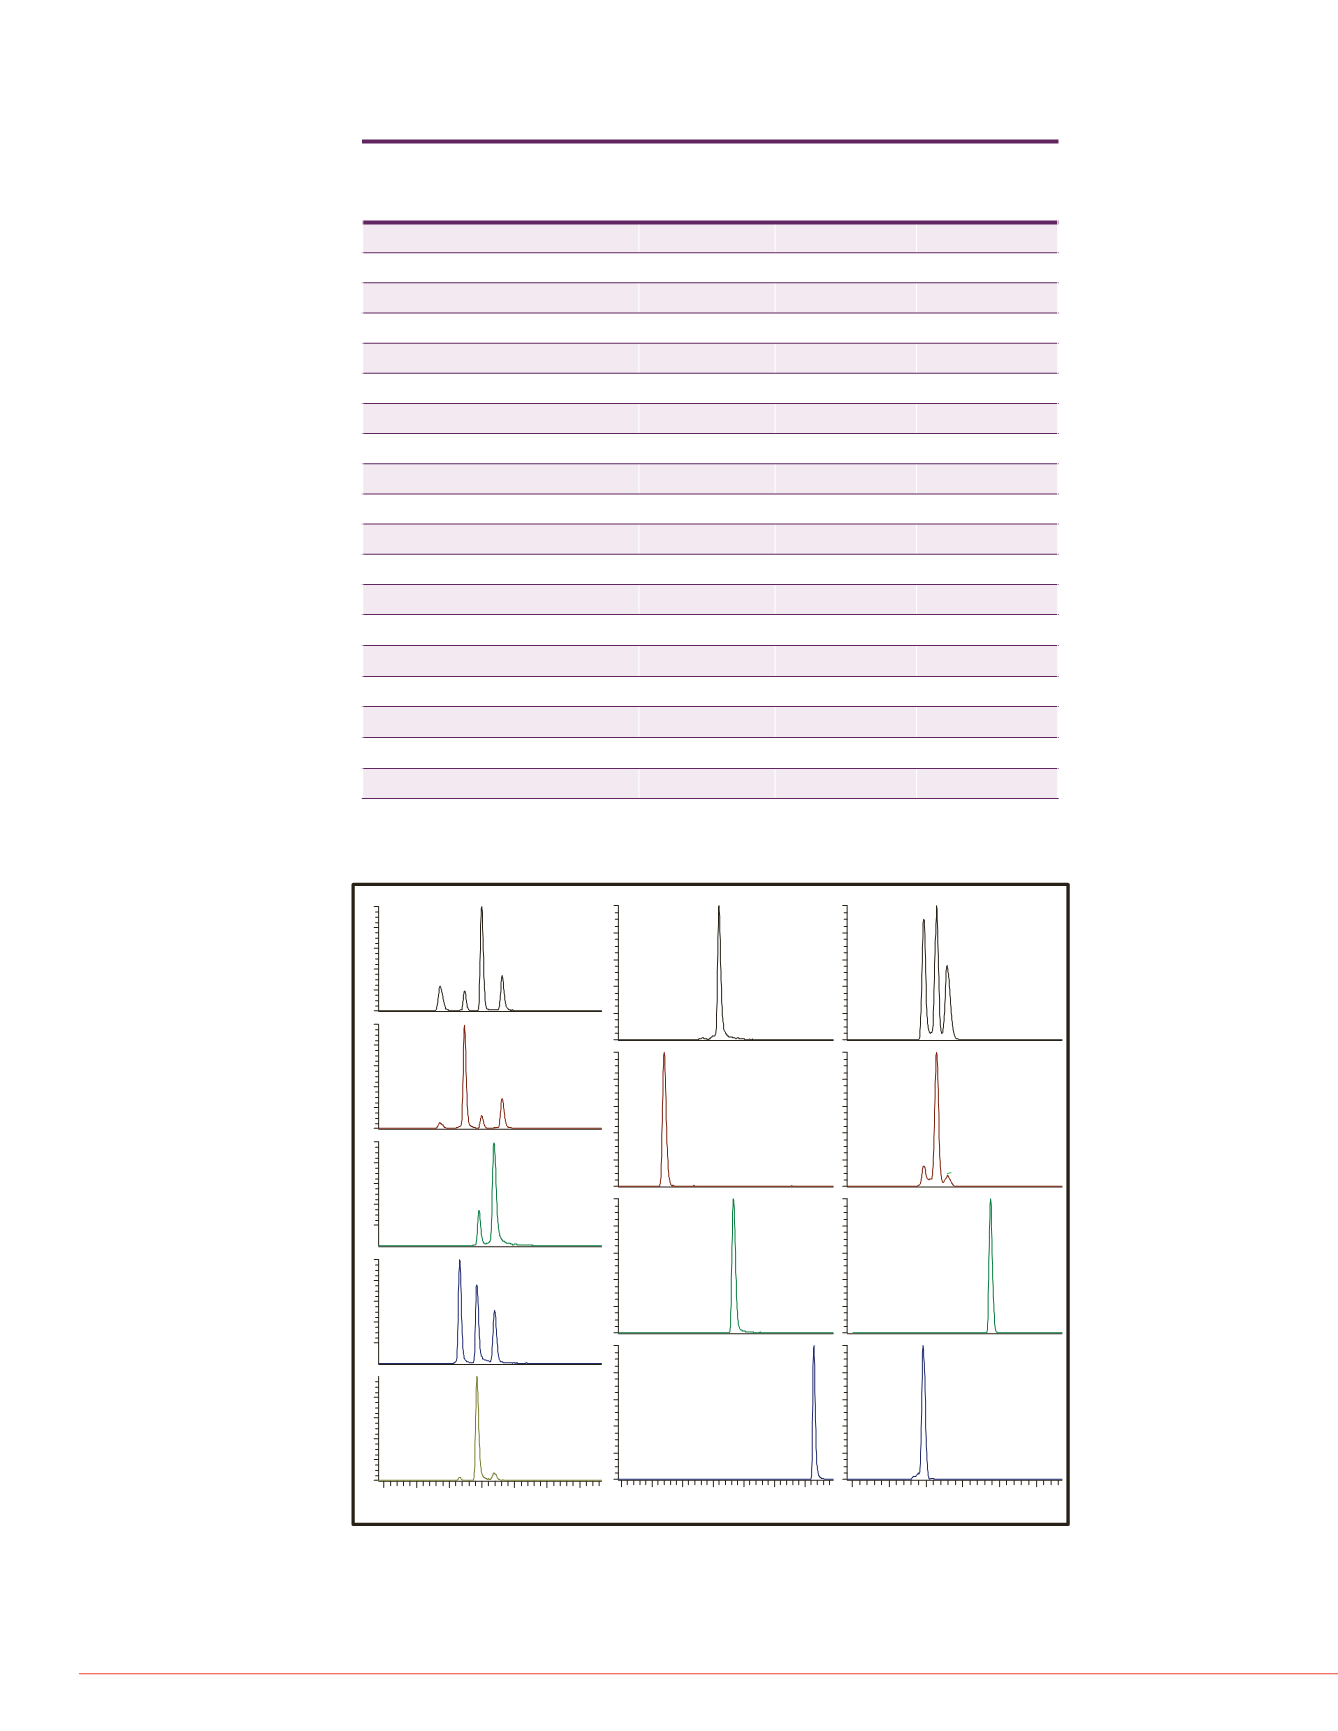
Morphine (1.86)
Norcodeine (2.50)
Norhydrocodone
(2.81)
Hydromorphone
(2.23)
Codeine (2.45)
Hydrocodone
(2.69)
Oxymorphone
(2.16)
Noroxycodone
(2.70)
Dihydrocodeine
(2.42)
Oxycodone
6-Acetylcodeine
Hydromorphone-
3
b
-glucuronide
(1.65)
6-Acetylmorphine
Normorphine
Codeine-6
b
-
glucuronide
Morphine-3
b
-
glucuronide (1.47)
Morphine-6
b
-
glucuronide (1.79)
Oxymorphon-3
b
-
glucuronide
1.46
2.83
Analyte
Accuracy
Precision
(%RSD)
Intra-Assay
Inter-Assay
Normorphine
94.6
<14.3
<5.7
Dihydromorphine
102
<14.1
<8.2
Morphine
99.2
<8.8
<4.8
Oxymorphone
103
<10.3
<3.5
Hydromorphone
102
<14.1
<5.8
Norcodeine
98.6
<9.6
<4.1
Dihydrocodeine
99.5
<11.1
<5.3
Codeine
99.2
<13.6
<5.7
Norhydrocodone
98.2
<13.5
<9.2
Oxycodone
99.4
<14.1
<5.8
Noroxycodone
100
<11.6
<10.4
Hydrocodone
95.2
<7.4
<5.0
6-Acetylmorphine
103
<9.7
<4.4
Codeine-6
b
-glucuronide
102
<8.5
<4.1
Oxymorphone-3
b
-glucuronide
100
<14.4
<4.4
Hydromorphone-3
b
-glucuronide
108
<7.9
<5.7
Morphine-3
b
-glucuronide
98.5
<14.9
<4.1
Morphine-6
b
-glucuronide
99.0
<10.8
<3.7
6-Acetylcodeine
102
<6.1
<6.9
Analyte
Normorphine
Morphine-3
b
-glucuronid
Oxymorphone-3
b
-glucur
Hydromorphone-3
b
-gluc
Morphine-6
b
-glucuronid
Codeine-6
b
-glucuronide
6-Acetylmorphine
6-Acetylcodeine
Dihydromorphine
Morphine
Oxymorphone
Hydromorphone
Codeine
Dihydrocodeine
Norcodeine
Oxycodone
Noroxycodone
Norhydrocodone
Hydrocodone
Noroxycodone-d
3
Norhydrocodone-d
3
6-Acetylmorphine-d
6
Morphine-6
b
-glucuronid
Morphine-d
3
Dihydrocodeine-d
6
Codeine-d
6
Hydromorphone-d
6
Morphine-3
b
-glucuronid
Oxycodone-d
6
Q Endura MS (right)
eter with a HESI-II ionization probe in
thod was performed using Thermo
Thermo Scientific™ TraceFinder™
FIGURE 2. Lower limit of quantitation chromatograms for all 19 compounds
s at a concentration range of
lity control (QC) samples were also
0 ng/mL. Accuracy and precision were
uality controls over four days and
eginning and end of the batch run.
lyte signal of the lower limit of
nd in the matrix blank after the upper
ot exceed 20% of the total LLOQ
s at 4
°
C) was determined by running
e autosampler and comparing them
g day.
within 15.0% for all QC and
was within 15.0% for all QC and
re shown in Table 2. All of the analytes
sampler stability. Example
or each of the compounds are shown
curves are shown for two
ne-6
b
-glucuronide was 0.9982 and
r all compounds within this method,
meters are shown in Table 3 Both
TSQ Endura MS used the same
ese two different quadrupole mass
ing for ease of use and quick
Morphine-6
b
-
Glucuronide
Area Ratio
Concentration (ng/
FIGURE 3. Representative c


