
4
Advantages of Ultra-High-Resolution Q Exactive Mass Spectrometer in Analysis of Unlimited Number of Compounds in Urine Quantitative Screening
Application for Forensics
MS method consisted of 2
and all ion fragmentation
ctra were collected with
ounds from different drug
g/mL) and QC samples
rine.
different donors at
zodiazepines) or 100 ng/mL
described in sample
against samples at the
e.
tific™ TraceFinder™
reconstructed with
m/z
d quantification. AIF
ation ranges and LOQ’s
data precision. Back-
LOQ.
sented in Figure 1.
ation standards of selected
in spiked urine samples
3.
Conclusi
A method
analysis of
Method line
screening i
Method is r
Method ca
analytical ti
FIGURE 2
.
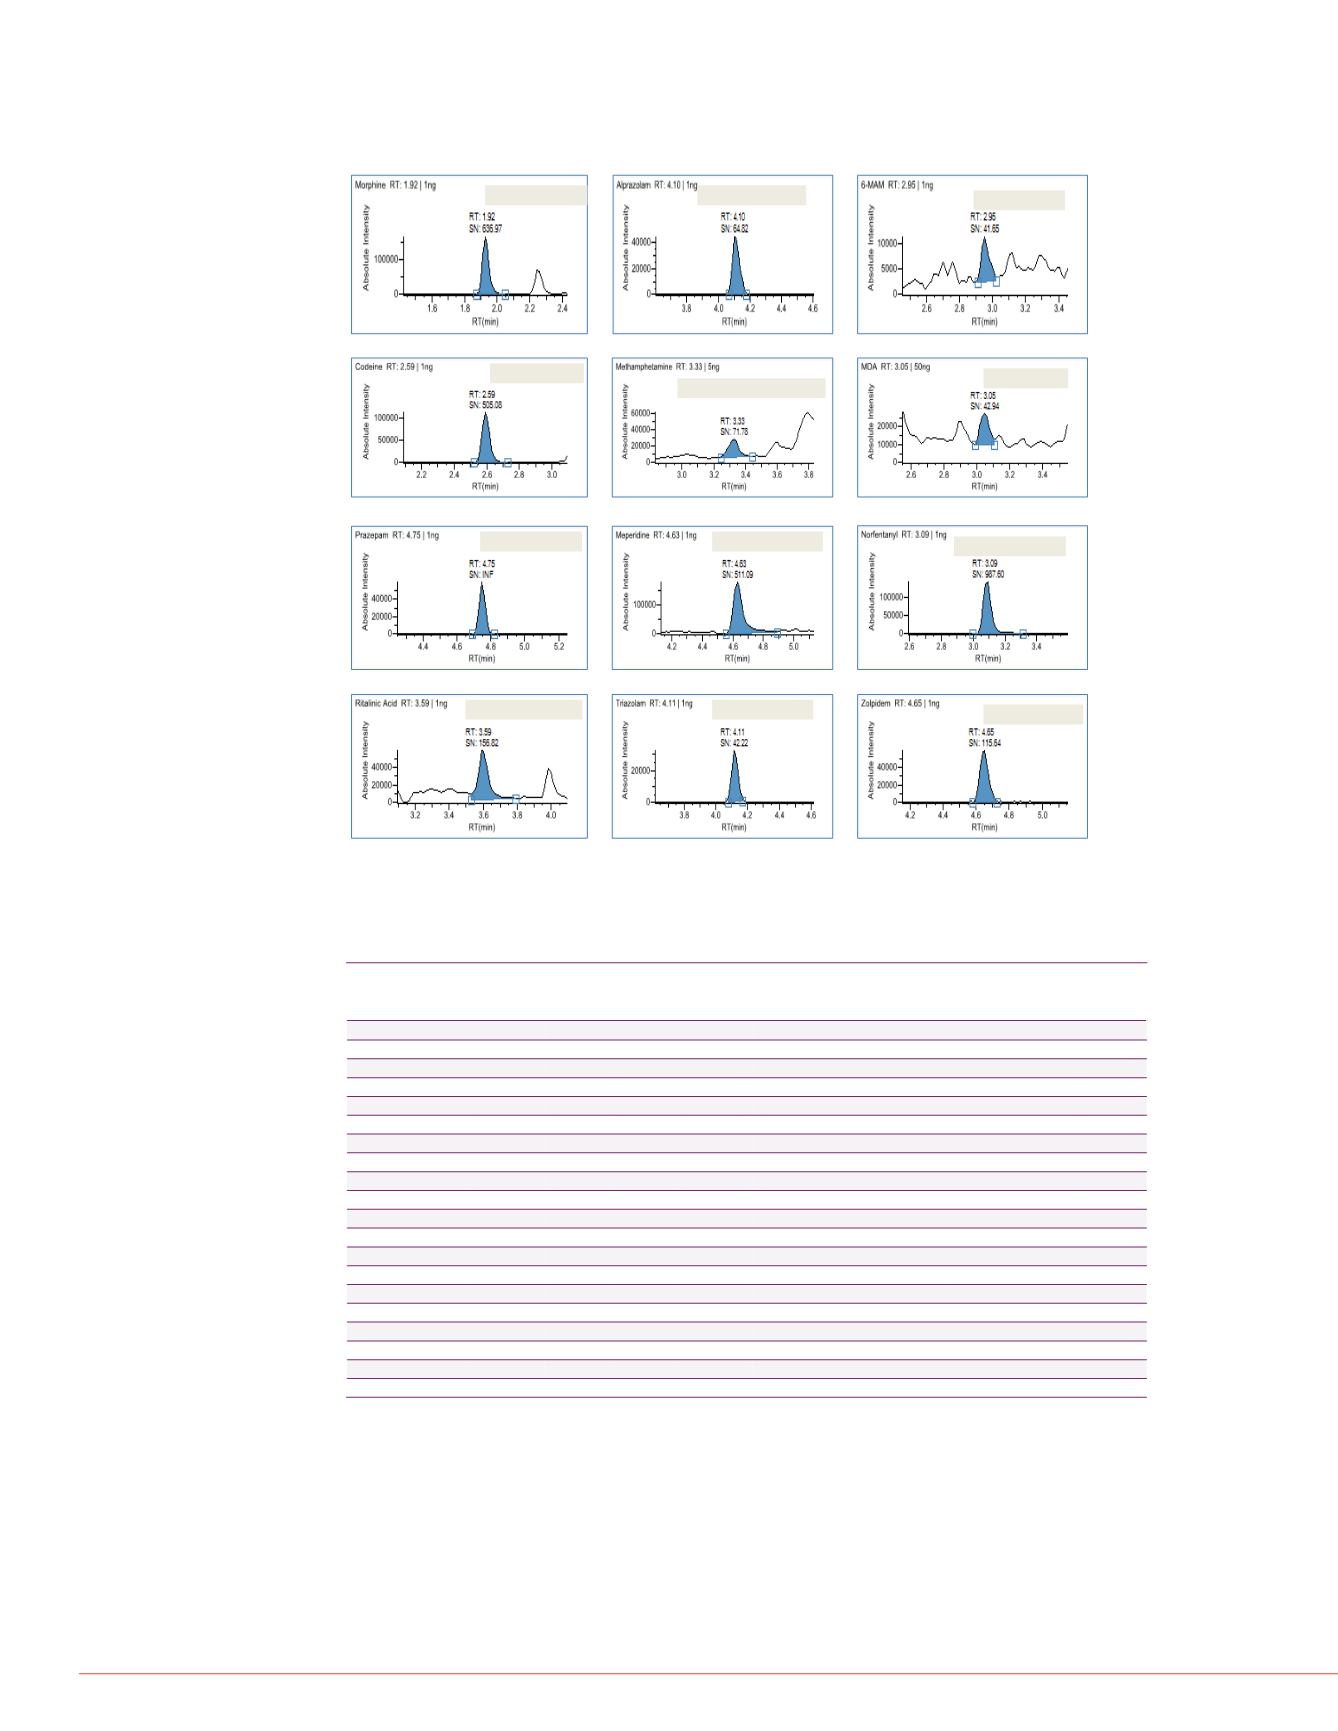
Chromatograms of the lowest calibration standards for selected
analytes as displayed in TraceFinder software.
Morphine 1 ng/mL
Alprazolam 1 ng/mL
6-MAM 1 ng/mL
Codeine 1 ng/mL
Methamphetamine5 ng/mL
MDA 50 ng/mL
Prazepam 1 ng/mL
Meperidine 1 ng/mL
Norfentanyl 1 ng/mL
Ritalinic Acid 1 ng/mL
Triazolam 1 ng/mL
Zolpidem 1 ng/mL
All trademarks are t
For Forensic Use
This information is n
intellectual property
eter in Analysis of Unlimited Number of
rensics
ctra of tramadol and
wn are the full-scan
, chromatogram of
accuracy of 5 ppm, and
peak. Chromatograms
ficient number of scans
4.20E6
70.00 [50.00-472.00]
200
250
300
350
400
450
m/z
230.0457 278.0593
333.1032
64
240.2316
419.3143
307.0857
222.1847
334.1065
441.2962
AIF spectrum
adol fragment
s
7.28E6
70.00 [50.00-472.00]
230.0457
333.1033
AIF spectrum
FIGURE 3
.
Example of calibration curves and calibration standard accuracy tables
for selected compounds. Note: tolbutamide was used as internal standard for all
analytes.
Table1. Linearity ranges, method precision and % recovery in spiked urine
samples from 15 different samples.
Compound
Calibration
range
(ng/ml)
Precision
2 ng/mL
(%RSD)
Precision
10 ng/mL
(%RSD)
Spike
Recovery
Compound
Calibration
range
(ng/ml)
Precision
2 ng/mL
(%RSD)
Precision
10 ng/mL
(%RSD)
Spike
Recovery
6-MAM
1–1000
10
9.6 97.6–127 Midazolam
1–1000 20.8
9.9 104–126
7-aminoclonazepam 1–1000 8.1
9.1 87.0–118 Morphine
1–1000 16.2
10.6 99.2–126
Alprazolam
1–1000 10.5
8.9 96.5–110 Nordiazepam
1–1000 16.8
8.7 92.4–110
Clonazepam
1–1000
13
6.8 91.4–118 Norfentanyl
1–1000 13.1
10.1 96.8–119
Clorazepate
1–1000
22
8.7 92.4–107 Norhydrocodone
1–1000
14
9.6 97.5–118
Codeine
1–1000 13.6
7.7 96.4–113 Normeperidine
1–1000 8.5
8.9 105–123
Diazepam
1–1000 11.8
8 98.9–116 Noroxycodone
1–1000 15.7
7 95.6–128
Dihydrocodeine
1–1000 13.6
9.7 97.7–112 Desmethyltramadol 1–1000 12.4
8.7 95.6–121
Flurazepam
1–1000 9.5
12.9 92.7–111 Oxazepam
1–1000 10.5
9.2 90.2–124
Hydrocodone
1–1000 8.4
8.1 94.0–117 Oxycodone
1–1000 19.3
12.2 99.0–126
Hydromorphone
1–1000 13.6
7.7 96.8–121 Oxymorphone
1–1000 12.8
8.4 93.2–117
Lorazepam
2–1000 18.2
12.7 86.5–122 Prazepam
1–1000 8.5
6.7 96.1–114
MDA
50–1000 NA
11.1* 88.7–112 Ritalinic Acid
1–1000 7.1
10 98.0–122
MDEA
2–1000 21.5
13.8 106–128 Tapentadol
1–1000 11.9
11.1 98.5–116
MDMA
25–1000 NA
16.9* 106–136 Temazepam
1–1000 10.5
9.8 91.5–114
Meperidine
1–1000 13.7
13.2 103–125 Tramadol
1–1000 12.1
11.9 107–129
Methadone
5–1000 NA
15.6 80.4–128 Triazolam
1–1000 8.5
8.9 96.6–110
Methamphetamine
5–1000 NA
18.1 104–138 Zolpidem
1–1000
14
12.2 99.4–116
Methylphenidate
1–1000 8.5
13.3 110–123
* Precision obtained for QC sample at concentration of 50 ng/mL


