
3
Thermo Scienti c Poster Note
•
PN ASMS13_W122_MKozak_E 07/13S
Exactive Pl
Compound
5 nM
50 nM 500 n
Propranolol
Diltiazem
Imipramine
Halperidol
Carbamazpine
Chlorpheniramine
Phentolamine
Buspirone
Verapamil
Desipramine
Clozapine
Acebutolol
Retonavir
Thioridazine
Nefazadone
Timolol
Minaprine
Fluphenazine
Metoprolol
Ticlopidine
Compound A
Erythromycin
Clomipramin
Bendamustine
Q Exactiv
Compound
5 nM
50 nM 500 n
Propranolol
Diltiazem
Imipramine
Halperidol
Carbamazpine
Chlorpheniramine
Phentolamine
Buspirone
Verapamil
Desipramine
Clozapine
Acebutolol
Retonavir
Thioridazine
Nefazadone
Timolol
Minaprine
Fluphenazine
Metoprolol
Ticlopidine
Compound A
Erythromycin
Clomipramin
Bendamustine
Incuded in Curve
Excluded from cu
ough high-resolution, accurate-
protein binding assay
analyzed using various scan
alysis LC-MS system and the
pole mass spectrometer.
tween 5 nM and 50 nM in full
samples analyzed using full
linear across 3 orders of
he results for the calculated
inding assay demonstrated a
tion, accurate-mass analysis
ple analysis performed using
all compounds in the assay
itivity for several compounds
asingly more powerful and
r new solutions to complex
ed and routine workspace,
will also benefit from the ease
ectrometric analysis but do not
omplex applications. In this
ere used to analyze a protein
rap™ mass analyzer and the
traditional LC-MS/MS on a
as selected based on reported
in an
in vitro
plasma protein
amples were incubated for 6.5
. Protein precipitation was
ng internal standard compound
te followed by addition of 50
re also generated for each
was first made for each
s of 5, 50, 500, 1000 and 2000
rom the working stock solution
1
.
1% Formic Acid (v/v) and
as held at 98% aqueous for
held at 98% B for 0.2 minutes
0.4 minute equilibration time.
8, 2.1 x 30 mm, 3µm column
were completed using a
ynamic Load and Wash) and
rate of 900 µL/min.
Exactive™ Plus mass
Thermo Scientific™ Q
0 – 900) and SIM mode with
z 200
and a spectral speed of
mple collection including
00 °C), sheath gas of 45
The instrument was
n using Thermo Scientific™
ion.
FIGURE 2. Heat map display of co
excluded for each scan mode used
Difference greater than 20% were e
Excluded calibration points comm
Excluded calibration points in 2 or
Results
Scan Mode Signal Response
Each compound analyzed in the plasma protein binding (PPB) assay was evaluated in
a concentration curve to evaluate overall sensitivity and linear dynamic range. All
compounds were serially diluted using PPB matrix blank solution with concentrations
ranging from 5 nM to 2000 nM concentration and analyzed using full scan and SIM
analysis. The calibration curves for all compounds were generated using a linear
regression and 1/x
2
weighting. Individual calibration points exceeding a % difference
of more than 20% of the regression line fit were excluded from the calibration curve.
The majority of the compounds analyzed in full scan and SIM mode analysis exhibit
the required sensitivity and linear dynamic range across the full range of the serial
dilution and correlate well to the results collected using MS/MS analysis with a triple
quadrupole mass spectrometer. Example calibration curves for each evaluated scan
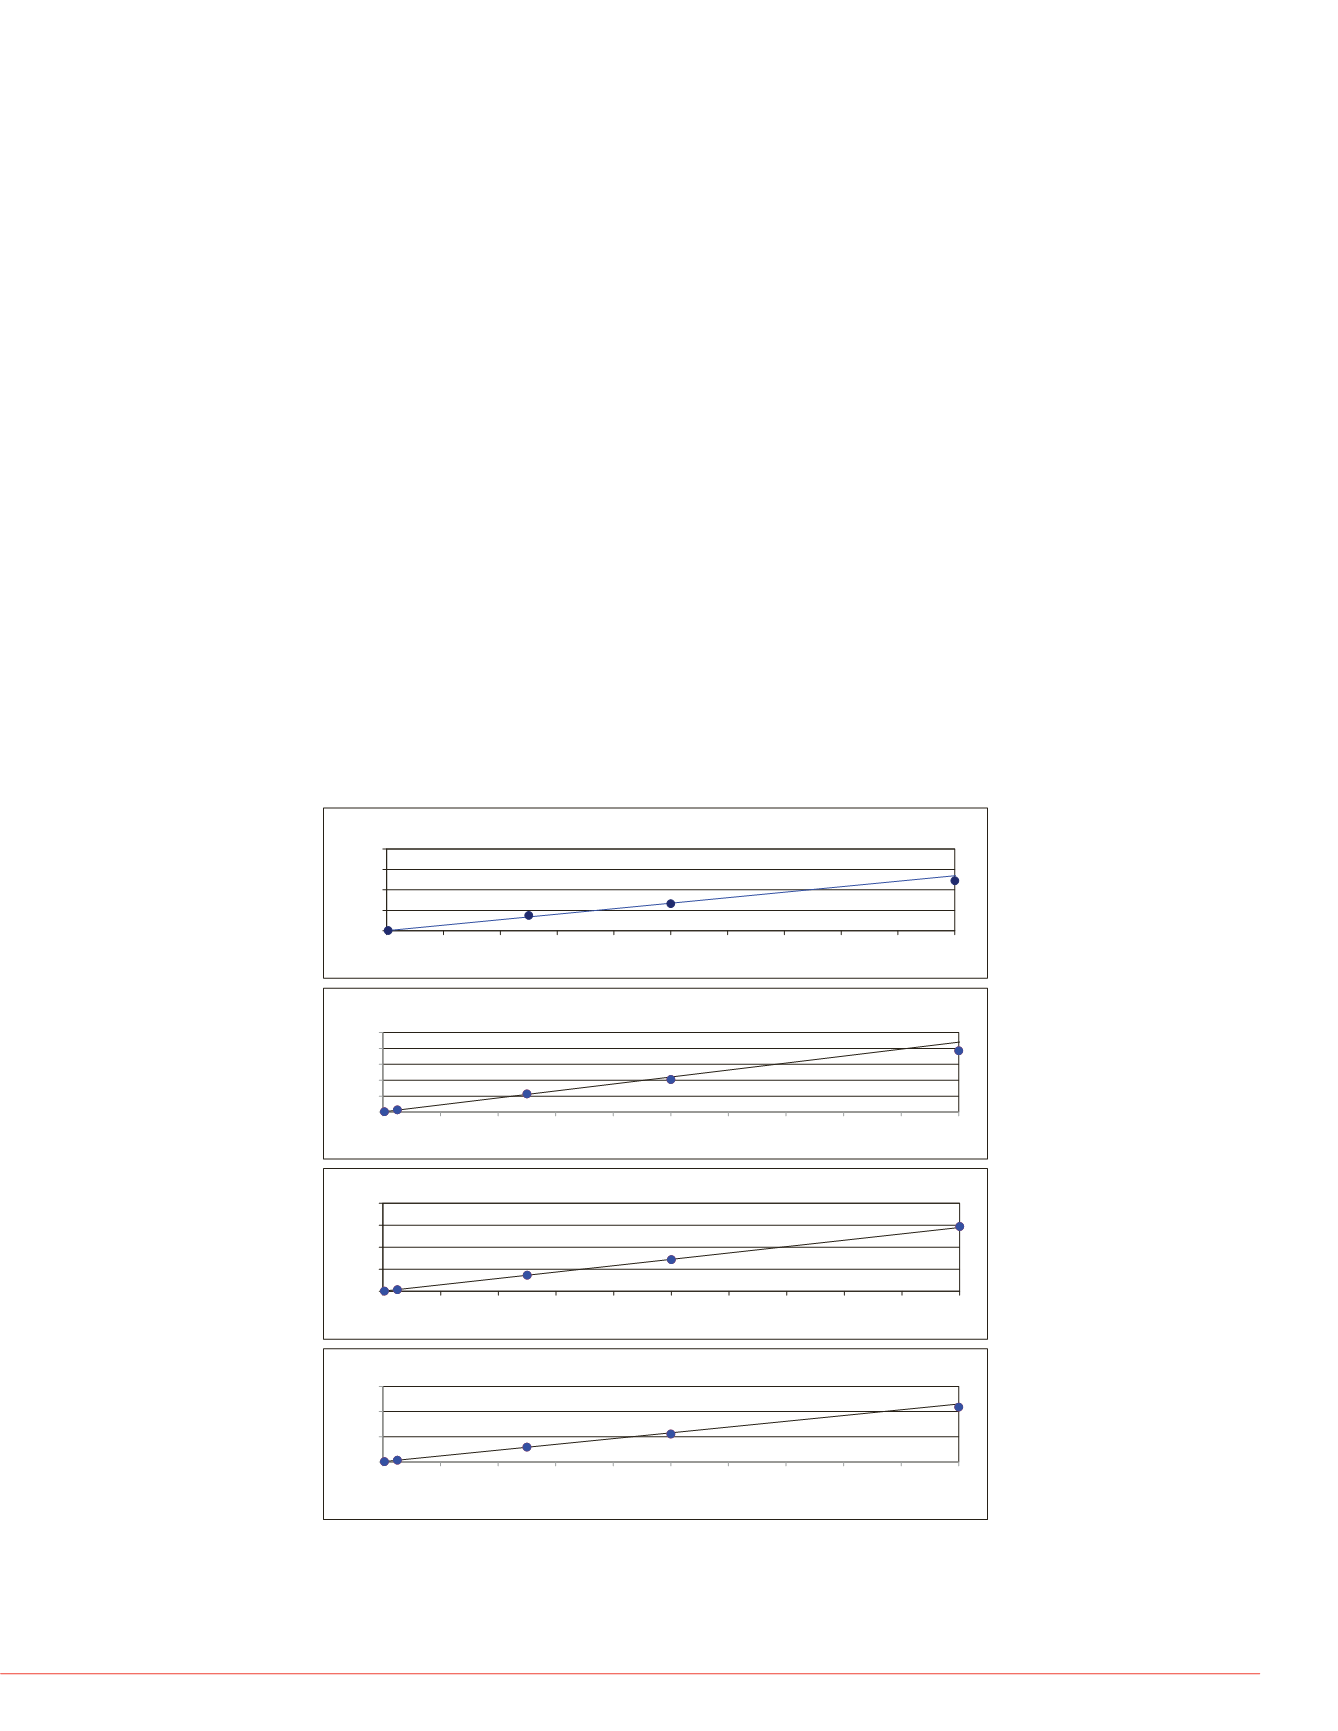
mode is displayed below for Fluphenazine (Figure 1).
The calibration curves for twenty-thre
MS/MS analysis were linear across th
compound calibration curve in the M
nM calibration point due to signal sat
analyzed using full scan and SIM mo
calibration point due to signal saturati
Orbitrap mass analyzer enables a us
ions collected for each scan during a
collected during each scan should lim
analysis. Due to sample volume limit
could not be performed for this experi
calibration curves demonstrated adeq
curves for twenty of twenty-four comp
improved sensitivity in full scan mode
calibration curve signal responses we
high-resolution platforms.
FIGURE 1. Calibration curve of Fluphenazine in each scan mode. (A) MS/MS
analysis, (B) Q Exactive SIM analysis, (C) Q Exactive Full Scan Analysis, (D)
Exactive Plus Full Scan Analysis
Data Analysis
Data was acquired using Thermo Scientific™ Xcalibur™ 2.2 and Exactive Tune 2.1
software. Chromatographic data review and calibration curve generation was
performed and reported using Thermo Scientific™ QuickCalc
software (powered by
Gubbs Inc., GMSU Gubbs™ Mass Spec Utilities, Atlanta, GA). Peak area
measurements in the buffer chamber of the dialysis plate were compared to the peak
area measurement in the serum chamber of the dialysis plate to calculate the percent
of unbound compound (% Free) at assay equilibrium
1
. The average % Free for each
compound replicate was reported for each analysis scan type and compared to values
obtained using a triple quadrupole mass spectrometer. The coefficient of variation of
the % Free values for each scan mode was also calculated for each compound
analyzed.
0
2
4
6
8
0
200
400
600
800
1000
1200
1400
1600
1800
2000
Peak Area Ratio
Concentration nM
Fluphenazine – Triple Quadrupole
R^2 = 0.99326
0
1
2
3
4
5
0
200
400
600
800
1000
1200
1400
1600
1800
2000
Area Ratio
Concentration nM
Fluphenazine – Q Exactive SIM
R^2 = 0.99775
0
2
4
6
8
0
200
400
600
800
1000
1200
1400
1600
1800
2000
Area Ratio
Concentration nM
Fluphenazine – Q Exactive Full Scan
R^2 = 0.99987
0
2
4
6
0
200
400
600
800
1000
1200
1400
1600
1800
2000
Area Ratio
Concentration nM
Fluphenazine – Exactive Plus Full Scan
R^2 = 0.99967
(D)
(C)
(B)
(A)


