
5
Thermo Scienti c Poster Note
•
PN ASMS13_W122_MKozak_E 07/13S
Q Exactive Full
nM 5 nM
50 nM 500 nM 1000 nM 2000 nM
Triple Quadrupole
nM 5 nM
50 nM 500 nM 1000 nM 2000 nM
Excluded from curve %Diff > 20%
and observed in 2 or fewer of the scan modes
0.00%
10.00%
20.00%
30.00%
40.00%
50.00%
60.00%
70.00%
80.00%
90.00%
100.00%
Propranolol
Diltiazem
Imipramine
Halperidol
Carbamazpine
Chlorpheniramine
Phentolamine
Buspirone
Verapamil
Desipramine
Clozapine
Acebutolol
Retonavir
Thioridazine
Nefazadone
Timolol
Minaprine
Fluphenazine
Metoptolol
Ticlopidine
Compound A
Erythromycin
Clomipramin
Bendamustine
PPB % Free Scan Type Comparison
QE SIM
QE Full
Exactive Plus
Triple
Conclusion
83% of compounds analy
92% of the compounds pr
the % Free in all scan mo
Full scan analysis using h
response and linear dyna
analyzed in the PPB assa
Additional sensitivity and l
method optimization.
References
1. Zhang J, Shou WZ, Vath
J, Weller HN., Rapid Com
Acknowledgem
We would like to thank Dr. Jun Z
Wallingford, CT for sample prep
ration curve points included and
. Calibration points with a %
the linear regression.
modes are labeled in yellow.
modes are labeled in red.
ty-four compounds analyzed using
f the calibration curve. One
required the exclusion of the 2000
f the twenty-four compounds
quired the exclusion of the 2000 nM
. High-resolution analysis using an
arameter for the amount of target
crease in the amount of ions
of signal saturation for future
ization of the ion collection target
an analysis of the compound
ity for the analysis of the calibration
. One compound demonstrated
Exactive Orbitrap MS, while all other
for full scan analysis across both
GMSU Gubbs™ Mass Spec Utilities is a tr
of Microsoft Corporation. All other tradema
This information is not intended to encour
intellectual property rights of others.
Twenty-two of the twenty-four c
provide a %CV of less than 25%
adequate sensitivity for analyte
compounds did not provide eno
did not provide enough signal fo
the compounds analyzed provid
with a %CV of less than 25%. T
sensitivity to generate a % Free
scan on the Exactive Plus only
observation maybe due to the g
used for data analysis. Although
Q Exactive filters all ions outsid
Exactive Plus does filter some i
mass range are also collected a
optimization of the ion target am
along with optimized chromatog
method may improve signal res
filtering with a quadrupole and
Q Exactive SIM
QE SIM
QE Full
E Plus Full
Triple
Compound
% Free
% Free
% Free
% Free
Avg(%)
StdDev(%)
% CV
Propranolol
30.03
30.45
33.01
30.00
30.87
1.44
4.66
Diltiazem
26.36
29.80
26.72
27.70
27.64
1.54
5.58
Imipramine
13.73
13.67
12.11
13.10
13.15
0.75
5.69
Halperidol
9.38
8.73
10.04
9.50
9.97
1.56
5.70
Carbamazpine
27.75
30.74
28.28
26.40
28.29
1.81
6.40
Chlorpheniramine
27.60
29.79
31.40
27.00
25.06
6.26
7.00
Phentolamine
36.84
38.43
40.39
33.80
37.36
2.79
7.46
Buspirone
20.33
20.22
23.04
23.30
20.12
2.73
7.71
Verapamil
16.66
15.29
18.43
16.20
16.64
1.32
7.92
Desipramine
18.37
18.32
15.76
16.10
17.14
1.40
8.18
Clozapine
7.45
7.10
6.10
6.70
6.88
0.58
8.42
Acebutolol
82.00
72.00
74.52
65.10
73.41
6.98
9.51
Retonavir
1.61
1.59
1.70
2.00
1.58
0.36
11.01
Thioridazine
0.60
0.69
0.58
0.50
0.64
0.13
12.93
Nefazadone
1.00
0.80
0.73
0.90
0.86
0.12
13.73
Timolol
73.40
67.20
90.13
88.10
79.71
11.19
14.03
Minaprine
25.05
34.90
27.30
28.60
21.97
7.32
14.57
Fluphenazine
1.53
1.38
1.70
1.20
1.51
0.31
14.64
Metoptolol
62.92
58.52
82.10
79.00
70.64
11.66
16.51
Ticlopidine
0.91
0.75
0.73
0.60
0.75
0.13
16.74
Compound A
1.00
1.20
1.50
1.24
0.25
20.22
Erythromycin
40.00
66.49
53.13
57.10
54.18
10.99
20.28
Clomipramin
4.31
7.10
6.08
6.70
5.66
1.99
20.38
Bendamustine
0.18
0.19
0.20
0.26
0.13
5.41
Analysis in SIM mode using the Q Exactive MS provided adequate sensitivity for all
compounds analyzed and provided a sensitivity improvement for some compounds
over full scan analysis (Figure 2).
PPB % Free Calculation
Percent free or unbound amount of compound in the protein binding assay was
calculated for each scan mode used for analysis
1
. The coefficient of variation of the %
Free across each scan mode was calculated for each compound and the results were
listed in a table and sorted from lowest to highest by %CV (Table 1).
Cells highlighted in red in Table 1 denote a scan mode that did not provide sufficient
signal for a specific compound to generate a % Free value and were excluded from
the %CV calculation for the respective compound.
Table 1. % Free for analyzed compounds in each scan mode and %CV across
scan modes. Cells highlighted in red denote scan modes with no results due to
lack of analyte signal.
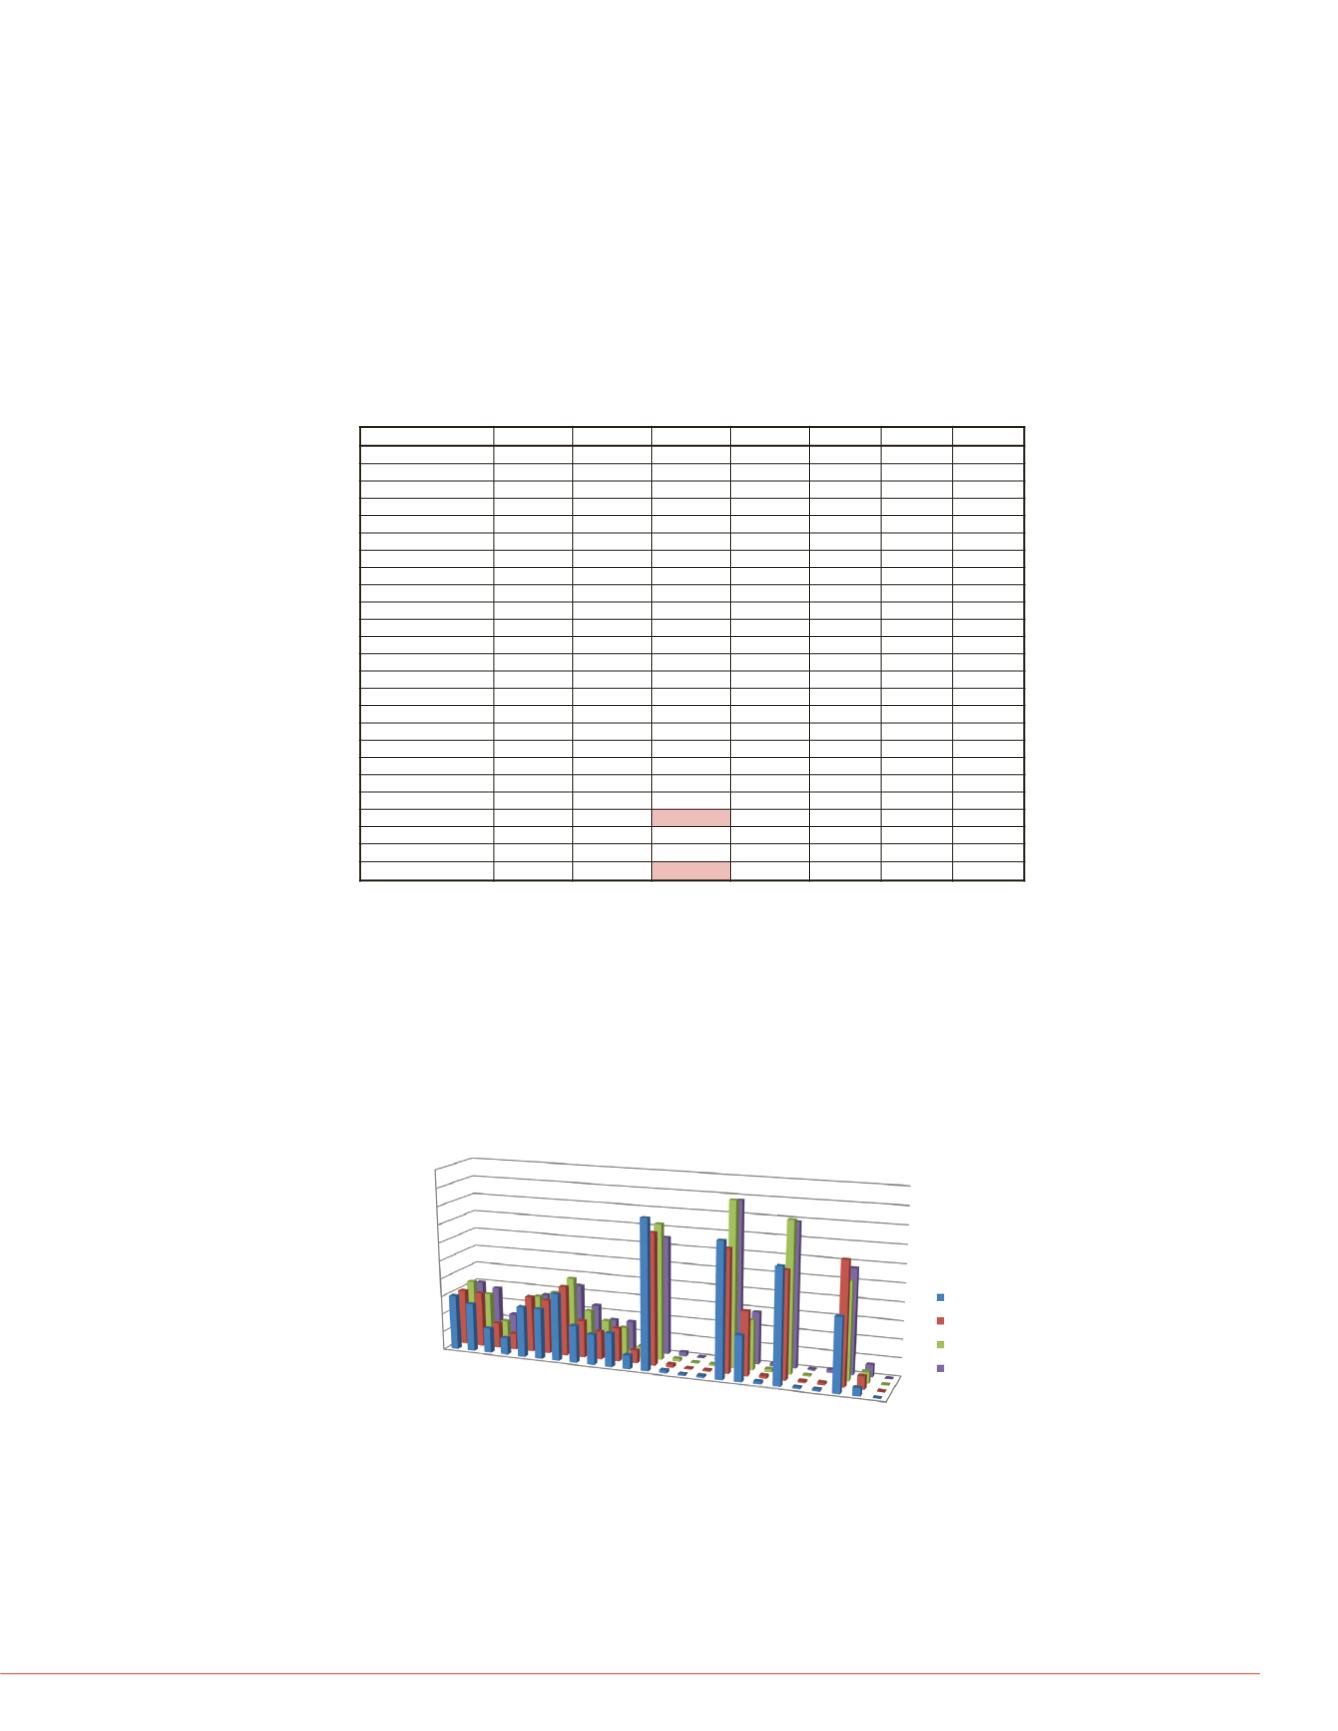
The calculated % Free values for each compound were plotted in a bar chart to
illustrate differences in the % Free values across each scan mode for the PPB
analysis.(Figure 3).
Figure 3. % Free for individual compounds across each scan mode used for
assay analysis. Twenty-two of twenty-four compounds analyzed demonstrate a
%CV of less than 25% across the various scan modes while providing adequate
sensitivity for assay analysis across all scan modes.


