
3
Thermo Scienti c Poster Note
•
PN ASMS13_M617_BDuretz_E 07/13S
Exactive
™ High
-Resolution Mass
or whole blood analysis and make a
uadrupole MS using the SRM
PLC/Diode Array Detection (DAD).
al standards and extracted with
lara, CA). LC separation was
rometry data were acquired in Full
solution screening over both the triple
d to identify an unlimited number of
ty of retrospective data analysis for
e is to separate the analytes of
em. Here we evaluated the Q
ultra
-high resolution mass
pm mass accuracy and 140,000
tFinder
™ data
processing software,
s. We will also compare the results
g using an SRM approach and DAD
µl of an internal standard solution
UBES A™ (Agilent Technologies).
to dryness, reconstituted in 2.5 ml of
30% of mobile phase B, and injected
alysis and DAD detection, the sample
ly, of the mixture described above.
la
™ 1250 pumps with an
Accela
um formate and 0.1% Formic acid in
). The LC separation was performed
olumn 150 x 2.1 mm
3µm.
spectrometer equipped with an
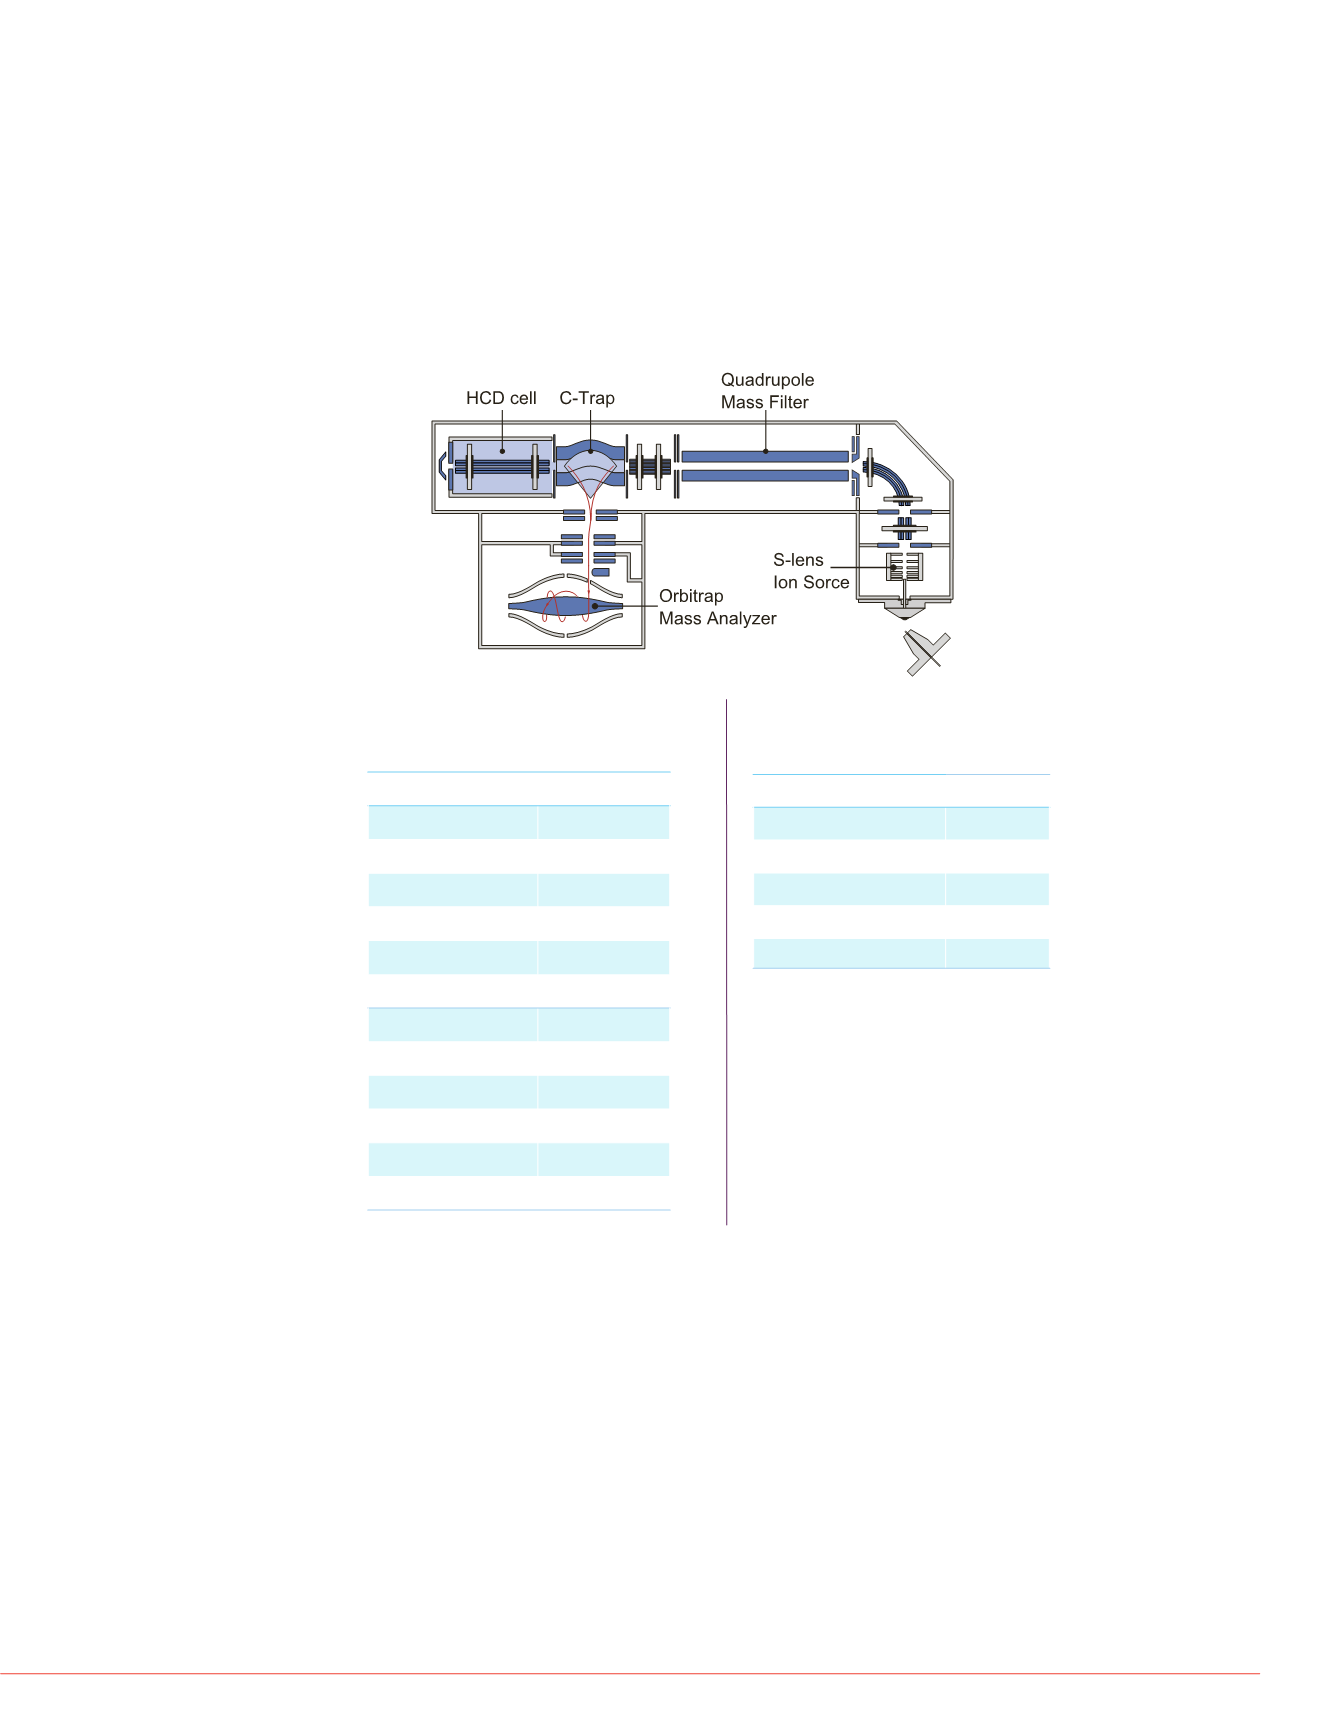
the Q Exactive MS is illustrated in
n (HESI) probe was used as an ion
ng positive and negative full scan
olution MS
2
scans in positive mode
e. Precursor selection was done in
ost intense ion of the previous scan
et to 70,000 FWHM for each full scan
n.
FIGURE 2. Schematic diagram of the Q Exactive High-Resolution,
Accurate-Mass Instrument.
Data Analysis
All MS data have been processed using ExactFinder 2.0 software. Identification of the
analytes is performed using the exact mass of the precursor, the retention time, the
isotopic distribution and the fragment exact masses.
Results
Data Processing
Chromatograms were reconstructed with a 5 ppm mass accuracy. The method was set
to identify compounds based on the exact mass of the parent and the retention time.
Confirmation was performed using the isotopic pattern and up to 5 fragment ions
obtained from each precursor. A database containing up to 650 analytes was selected
for processing. Figure 5 shows an example of the results page showing the XIC
(extracted ion chromatogram) for Nordiazepam reconstructed with 5 ppm mass
accuracy (a), isotopic pattern (b) and fragment ion confirmation (c).
%B
5
45
70
95
95
5
5
FIGURE 3. Scan Parameters for Q Exactive
Mass Spectrometer
FIGURE 4. Source Parameters
for HESI Probe.
Parameter
Value
Full MS
Microscans
1
Resolution (FWHM)
70,000
AGC Target
1e6
Maximum IT
250 msec
Scan Range
150-800 m/z
MS
2
Experiments
Microscans
1
Resolution
17,500
AGC Target
1e5
Maximum IT
250 msec
NCE
70.0
Parameter
Value
Sheath Gas
30
Aux gas
15
Spray voltage (V)
3500
Capillary temp (
°
C)
320
Vaporizer Temp (
°
C)
350
FIGURE 5. ExactFinder resul
reconstructed with 5 ppm m
ion confirmation (c).
Metabolite Identification
In addition to compound identif
potential metabolites present i
is performed in Full Scan mod
same HR-MS analysis by o
biotransformations. Figure 6 s
sample. The main compound i
identify two major metabolites:
* Parameters are the same for
positive and negative modes
Results are reported using flag
•
(green circle): Whe
and fully confirmed.
•
(yellow triangle): W
identified but not fully co
•
(red square): When
identified.
MS
2
spectra were acquired with a Normalized Collision Energy (NCE) of 70. Relevant
scan and source parameters are shown in Figures 3 and 4.
DAD Detection
Data have been acquired on a UPLC-Acquity
™ (
Waters Corporation, Milford, MA)
equipped with a DAD detector. The library contains 612 molecules. Acquisition is
performed using a 15 minute LC gradient.
Triple Quadrupole Detection
Six different targeted LC/MSMS methods have been used to acquire data in SRM
(Selected Reaction Monitoring) mode. This method includes 97 molecules.
FIGURE 6. ExactFinder resu
EMDP (b) and Methadone (c)
(a)


