
4
Quantitation of Seven Designer Cathinones in Urine Using Q Exactive Mass Spectrometer
Exactive Plus Full
Q Exactive Full
Compound
5 nM
50 nM 500 nM 1000 nM 2000 nM 5 nM
50 nM 500 nM 1000 nM 2000 nM
Propranolol
Diltiazem
Imipramine
Halperidol
Carbamazpine
Chlorpheniramine
Phentolamine
Buspirone
Verapamil
Desipramine
Clozapine
Acebutolol
Retonavir
Thioridazine
Nefazadone
Timolol
Minaprine
Fluphenazine
Metoprolol
Ticlopidine
Compound A
Erythromycin
Clomipramin
Bendamustine
Q Exactive SIM
Triple Quadrupole
Compound
5 nM
50 nM 500 nM 1000 nM 2000 nM 5 nM
50 nM 500 nM 1000 nM 2000 nM
Propranolol
Diltiazem
Imipramine
Halperidol
Carbamazpine
Chlorpheniramine
Phentolamine
Buspirone
Verapamil
Desipramine
Clozapine
Acebutolol
Retonavir
Thioridazine
Nefazadone
Timolol
Minaprine
Fluphenazine
Metoprolol
Ticlopidine
Compound A
Erythromycin
Clomipramin
Bendamustine
Incuded in Curve
Excluded from curve %Diff > 20%
Excluded from curve %Diff > 20% and observed in 2 or fewer of the scan modes
0.00%
10.00%
20.00%
30.00%
40.00%
50.00%
60.00%
70.00%
80.00%
90.00%
100.00%
Propranolol
Diltiazem
Imipramine
Halperidol
Carbamazpine
Chlorpheniramine
Phentolamine
Buspirone
Verapamil
PPB %
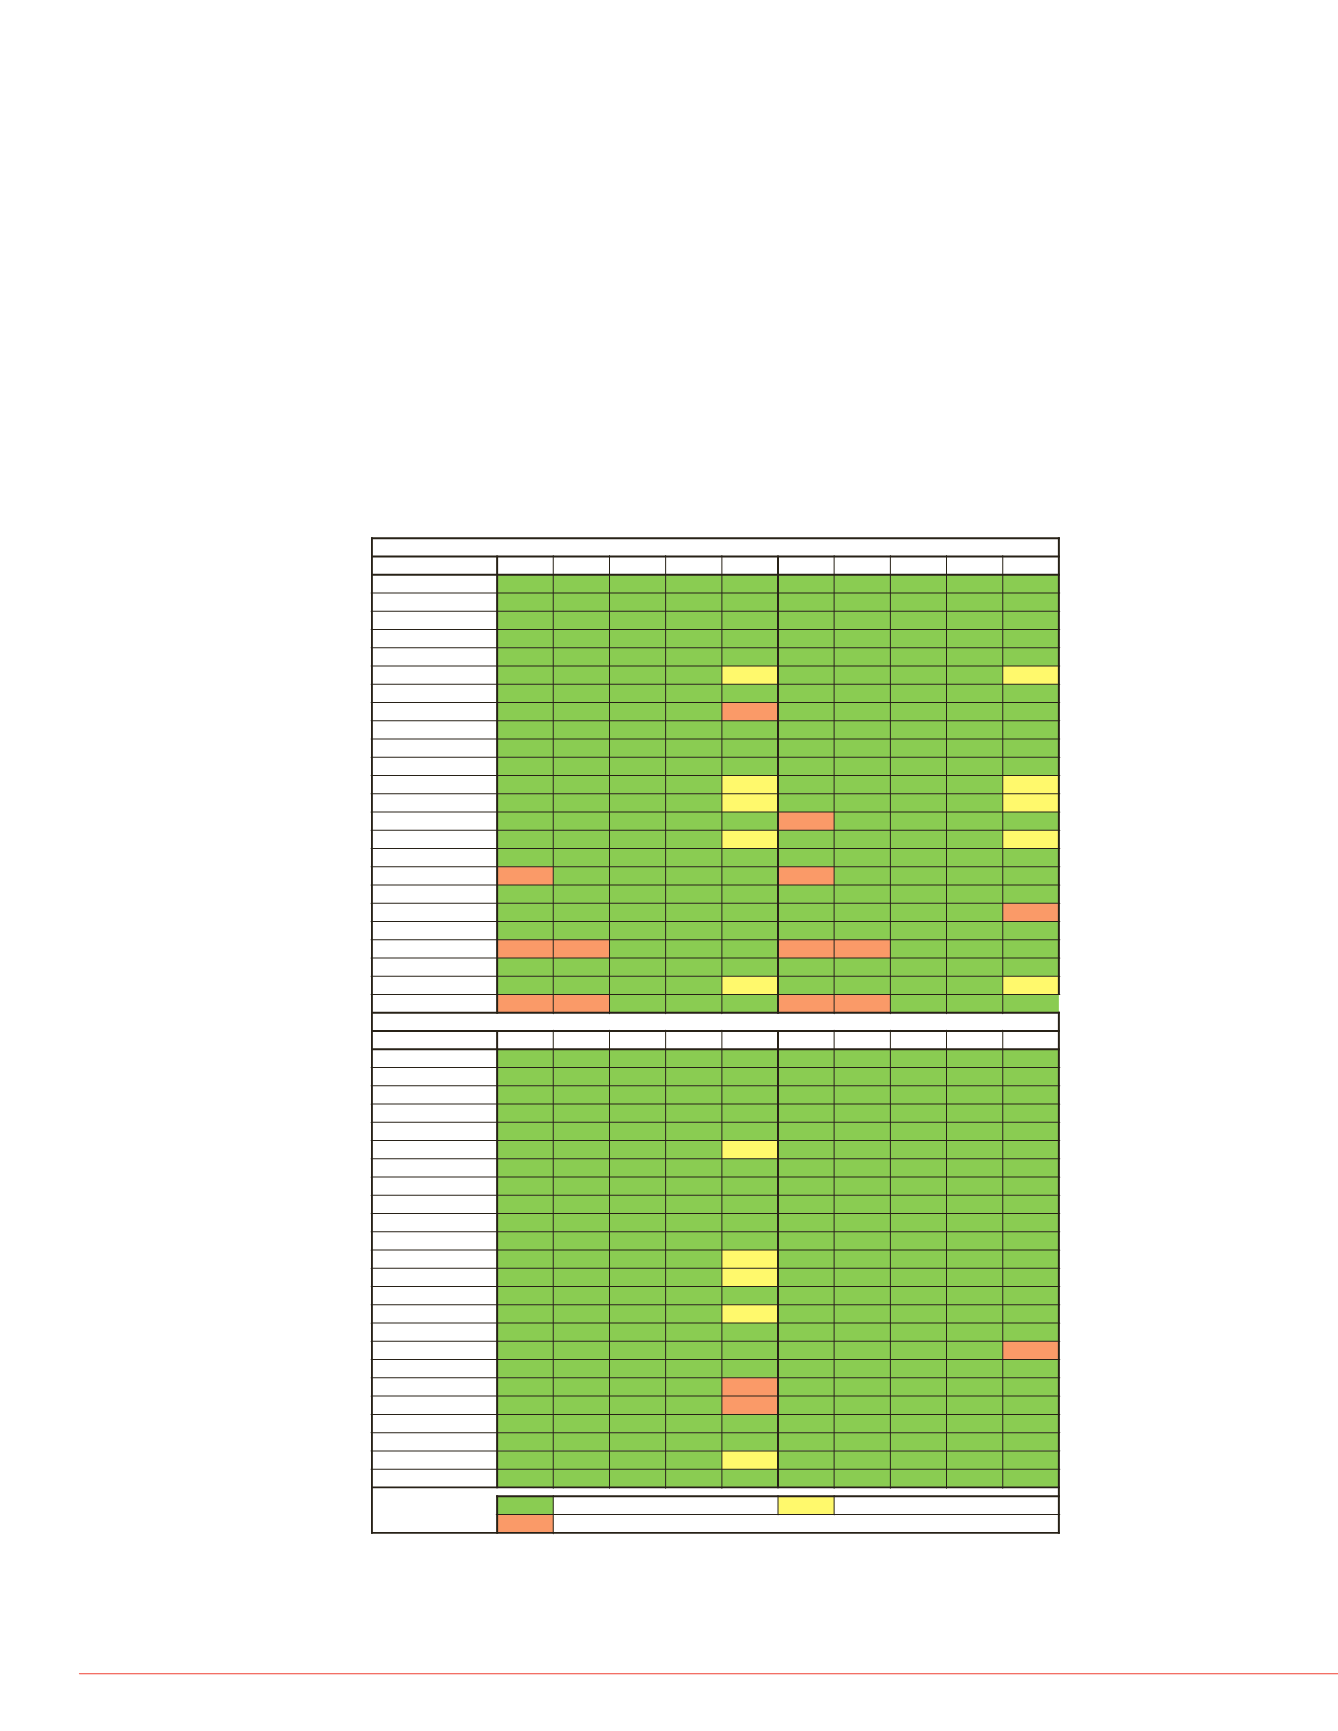
FIGURE 2. Heat map display of compound calibration curve points included and
excluded for each scan mode used for analysis. Calibration points with a %
Difference greater than 20% were excluded from the linear regression.
Excluded calibration points common to 3 scan modes are labeled in yellow.
Excluded calibration points in 2 or fewer scan modes are labeled in red.
inding (PPB) assay was evaluated in
ity and linear dynamic range. All
ix blank solution with concentrations
analyzed using full scan and SIM
s were generated using a linear
ion points exceeding a % difference
xcluded from the calibration curve.
can and SIM mode analysis exhibit
across the full range of the serial
using MS/MS analysis with a triple
ation curves for each evaluated scan
e 1).
The calibration curves for twenty-three of the twenty-four compounds analyzed using
MS/MS analysis were linear across the full range of the calibration curve. One
compound calibration curve in the MS/MS analysis required the exclusion of the 2000
nM calibration point due to signal saturation. Six of the twenty-four compounds
analyzed using full scan and SIM mode analysis required the exclusion of the 2000 nM
calibration point due to signal saturation (Figure 2). High-resolution analysis using an
Orbitrap mass analyzer enables a user-definable parameter for the amount of target
ions collected for each scan during analysis. An increase in the amount of ions
collected during each scan should limit the effects of signal saturation for future
analysis. Due to sample volume limitations, optimization of the ion collection target
could not be performed for this experiment. Full scan analysis of the compound
calibration curves demonstrated adequate sensitivity for the analysis of the calibration
curves for twenty of twenty-four compounds or 83%. One compound demonstrated
improved sensitivity in full scan mode using the Q Exactive Orbitrap MS, while all other
calibration curve signal responses were consistent for full scan analysis across both
high-resolution platforms.
in each scan mode. (A) MS/MS
xactive Full Scan Analysis, (D)
alibur™ 2.2 and Exactive Tune 2.1
bration curve generation was
QuickCalc
software (powered by
Atlanta, GA). Peak area
sis plate were compared to the peak
dialysis plate to calculate the percent
rium
1
. The average % Free for each
sis scan type and compared to values
eter. The coefficient of variation of
calculated for each compound
Q Exactive SIM
QE SIM
Compound
% Free
Propranolol
30.03
Diltiazem
26.36
Imipramine
13.73
Halperidol
9.38
Carbamazpine
27.75
Chlorpheniramine
27.60
Phentolamine
36.84
Buspirone
20.33
Verapamil
16.66
Desipramine
18.37
Clozapine
7.45
Acebutolol
82.00
Retonavir
1.61
Thioridazine
0.60
Nefazadone
1.00
Timolol
73.40
Minaprine
25.05
Fluphenazine
1.53
Metoptolol
62.92
Ticlopidine
0.91
Compound A
1.00
Erythromycin
40.00
Clomipramin
4.31
Bendamustine
0.18
1200
1400
1600
1800
2000
n nM
Triple Quadrupole
1200
1400
1600
1800
2000
on nM
xactive SIM
1200
1400
1600
1800
2000
on nM
tive Full Scan
1200
1400
1600
1800
2000
on nM
Plus Full Scan
Analysis in SIM mode using th
compounds analyzed and pro
over full scan analysis (Figure
PPB % Free Calculation
Percent free or unbound amou
calculated for each scan mode
Free across each scan mode
listed in a table and sorted fro
Cells highlighted in red in Tabl
signal for a specific compound
the %CV calculation for the re
Table 1. % Free for analyzed
scan modes. Cells highlight
lack of analyte signal.
The calculated % Free values
illustrate differences in the %
analysis.(Figure 3).
Figure 3. % Free for individ
assay analysis. Twenty-two
%CV of less than 25% acros
sensitivity for assay analysi


