
4
LC/MS/MS Research Method for 14 Antidepressants Utilizing Dried Blood Spots
mode and equipped with a Thermo
50 mm cleanup column and a
o Scientific™
Accucore
™
aQ analytical
s a TSQ Endura triple quadrupole mass
ionization (HESI-II) probe in positive
software version 3.1 was used for
flow path is found in Figure 3.
m formate, 0.05% formic acid in water;
rmic acid in methanol; and (C)
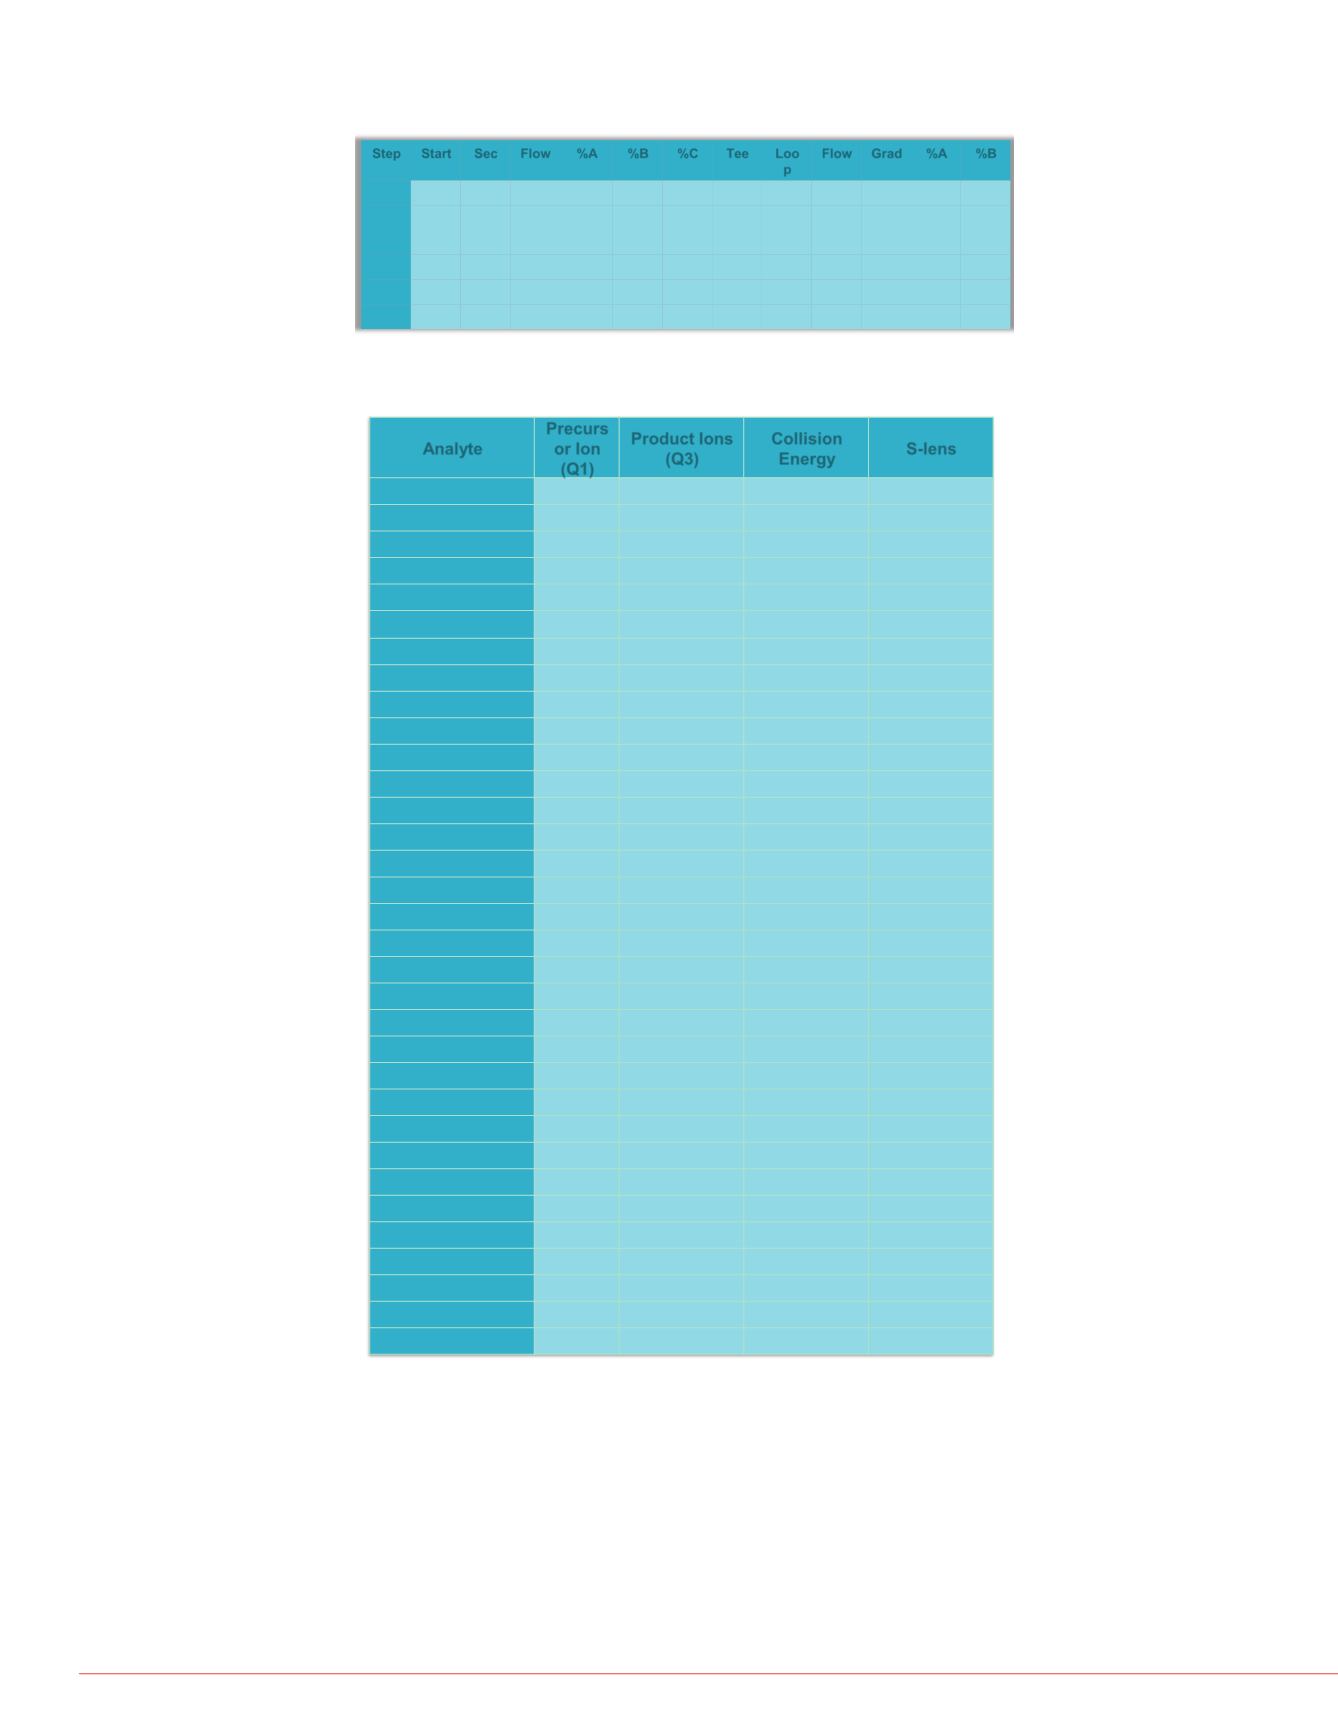
e. The LC method is shown in Table 1.
alifier selected-reaction monitoring
The method range for all the analytes
Add200µL of IS inmethanol
Vortex for20 minutes
ter
Placepunchedhole into96wellplate
ried blood spot for LC/MS
nalytic separation flow path
TABLE 2. SRM transitions
Step Start
Sec
Flow
%A
%B
%C
Tee
Loo
p
Flow Grad
%A
%B
1
0.00
40
1.5
100.0
-
-
====
out
0.50
100
-
2
0.67
65
0.20
-
100
-
T
in
0.50
100
-
3
1.75
5
0.20
-
100
-
====
in
0.50
40
60
4
1.83
120
1.20
-
-
100
====
out
0.50
25
75
5
3.83
30
1.10
-
-
100
====
out
0.50
-
100
6
4.33
60
1.50
100
-
-
====
out
0.50
100
-
Analyte
Precurs
or Ion
(Q1)
Product Ions
(Q3)
Collision
Energy
S-lens
Amitriptyline
278.1
233.2
15
61
191.1
15
61
Doxepin
280.2
235.0
26
61
Imipramine
281.0
86.3
25
88
208.0
25
88
Fluvoxamine
319.1
200.0
19
70
228.0
19
70
Clomipramine
314.9
86.2
20
55
242.1
20
55
Fluoxetine
310.1
117.1
10
83
148.0
10
83
Paroxetine
330.1
192.0
28
94
151.0
28
94
Citalopram
325.1
109.1
25
120
262.0
25
120
Nortiptyline
264.1
233.0
20
50
191.0
20
50
Desipramine
267.1
208.1
20
48
236.1
20
48
Venlafaxine
278.2
147.1
15
61
121.1
15
61
Sertraline
306.0
275.0
13
80
158.9
13
80
Duloxetine
298.0
154.0
8
55
-
Bupropion
241.0
167.0
15
61
185.0
15
61
Amitriptyline-d
3
281.1
233.2
24
90
Doxepin-d
3
283.2
235.1
24
106
Fluoxetine-d
6
316.1
154.0
16
79
Paroxetine-d
6
336.1
198.1
20
125
Nortiptyline-d
3
267.1
233.1
18
97
Sertraline-d
3
309.0
275.0
12
69
TABLE 1. LC method parameters
Results
One day of accuracy and precision measu
each of the following analytes: amitriptyli
clomipramine, fluoxetine, paroxetine, cita
sertraline, duloxeine, and bupropion. The
were tested from 10
–
750 ng/mL for each
Table 3. The assay precision had RSD val
tested; LOQ compounds had values less t
the theoretical value for all assays. The co
ranged from 0.9900 to 0.9950, showing li
All analytes passed carryover, recovery, a
autosampler stability criteria. Recoveries
Example SRM chromatograms at the LO
calibration curves are shown in Figure 5.
TABLE 3. Quality control accuracy
Analyte
Expected
Conc
Amitriptylin
Doxepin
Impiramine
Fluvoxamine
Clomipramine
Level
Low
20
AVG
17.6
18.0
19.9
19.6
19.3
%RSD
12.25
10.25
0.20
2.00
3.70
Mid
110
AVG
113
98
115
125
116
%RSD
3.14
11.18
4.29
8.87
5.82
High
380
AVG
399
336
409
423
411
%RSD
4.95
11.36
7.58
11.26
8.05
FIGURE 4. Representative chromat
0
250
500
0
1
2
3
0
300
600
0
1
0
250
500
750
0
1
2
3
0
500
1000
0
1
2
3
0
1000
2000
0
0
1500
3000
0
1
2
3
0
500
1000
1500
0
Amitriptylin
Fluvoxamine
Paroxetine
Desipramine
Duloxetine
0
400
800
0
1
0
200
400
0
1
2
3
0
600
1200
0


