
3
Thermo Scientific Poster Note
•
PN-64075-ASMS-EN-0614S
hod for measuring the
spots (DBS).
o extract 14 antidepressants
uccessful from dried blood
ion.
blood are accurate
volume, and easy extraction.
l research technique for the
complexity of the solution
e must undergo further
oduction into the mass
ated using the Thermo
mo Scientific™
er (Figure 1) to quantitatively
ied blood spots.
Instrumentation
A Prelude SPLC system was used in TX mode and equipped with a Thermo
Scientific™
TurboFlow
™
Fluoro XL 0.5 x 50 mm cleanup column and a
2.1 x 50 mm, 2.6 µm particle size Thermo Scientific™
Accucore
™
aQ analytical
column. The detector for the system was a TSQ Endura triple quadrupole mass
spectrometer with a heated electrospray ionization (HESI-II) probe in positive
mode. Thermo Scientific™
TraceFinder
™ software version 3.1 was used for
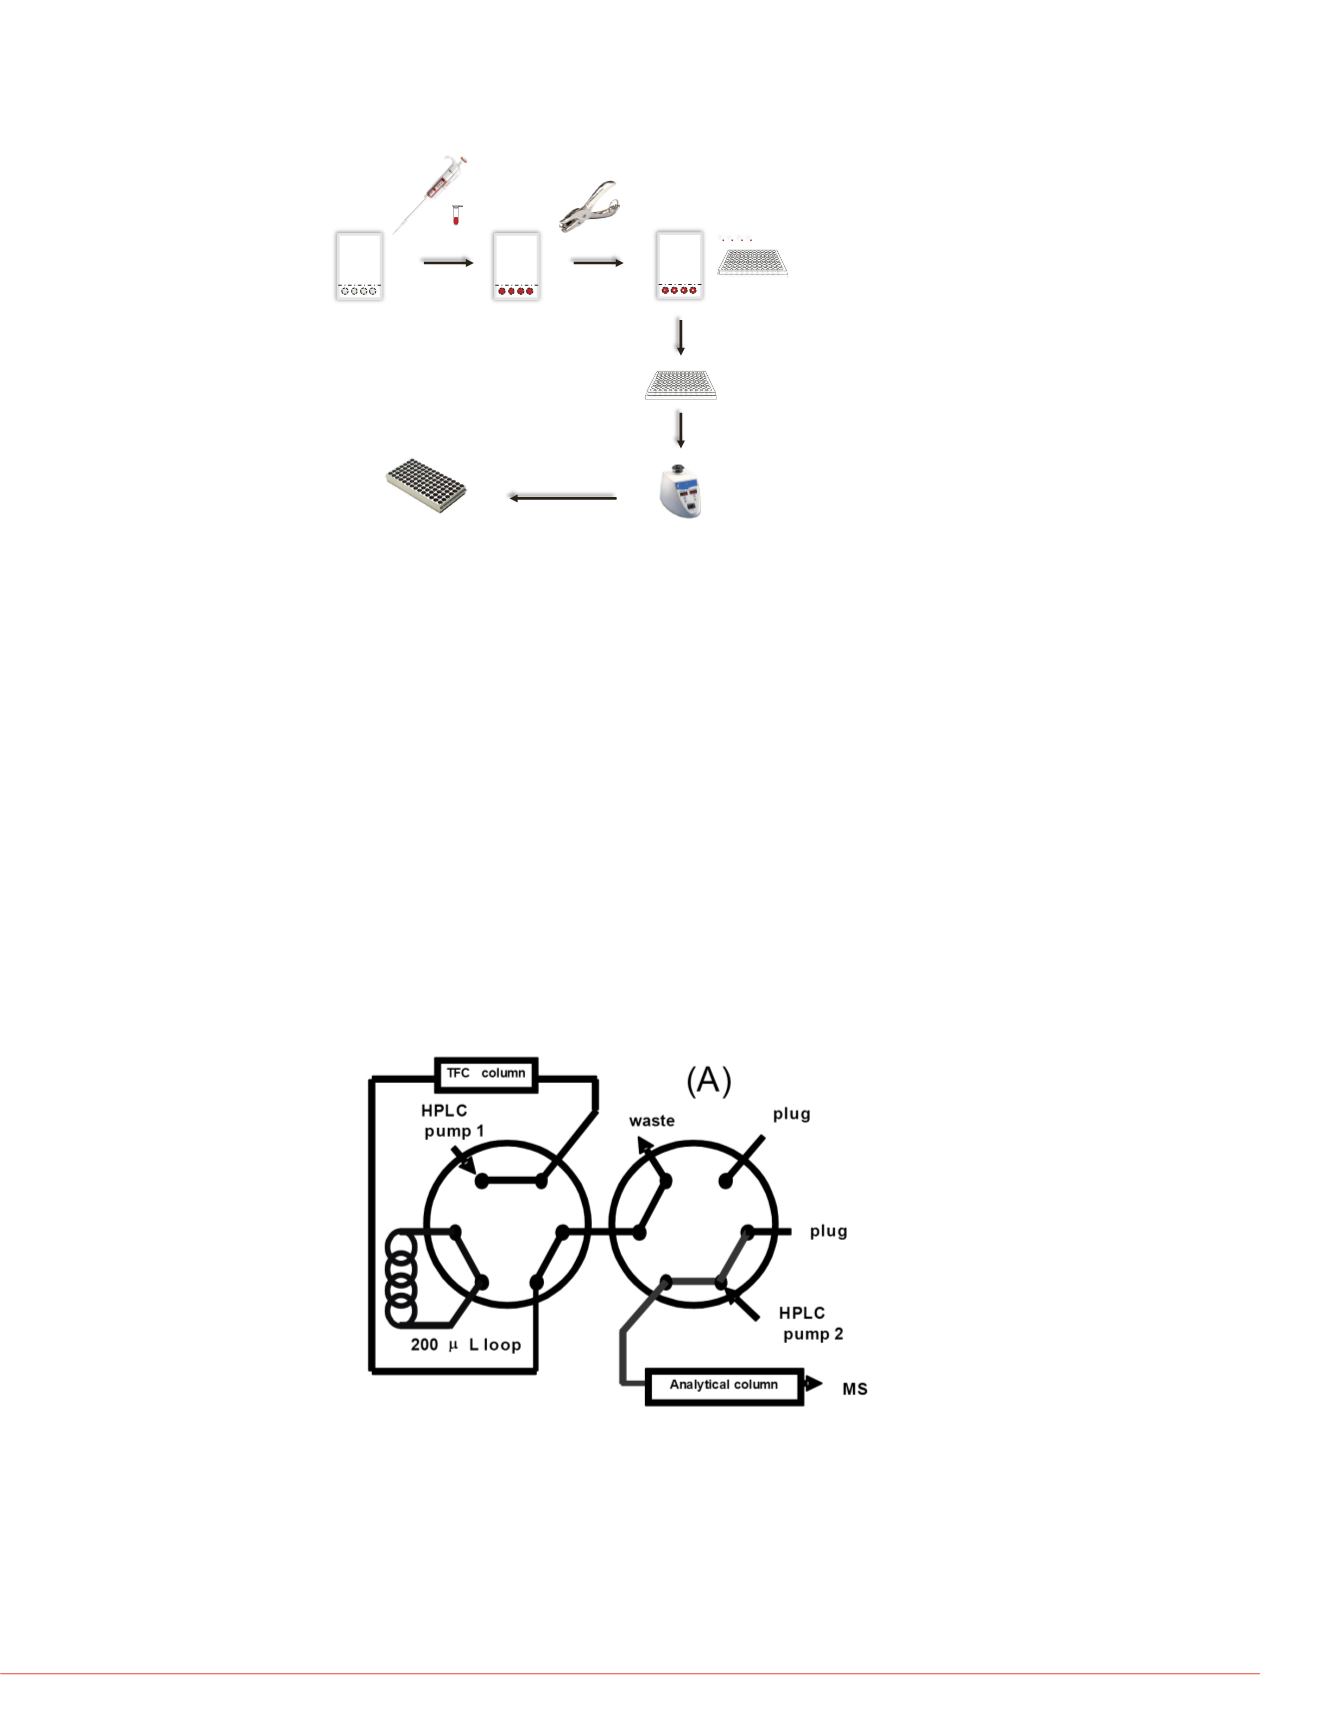
quantitation. The liquid chromatography flow path is found in Figure 3.
Method Parameters
Mobile phases were (A) 10 mM ammonium formate, 0.05% formic acid in water;
(B) 10 mM ammonium formate, 0.05% formic acid in methanol; and (C)
45/45/10 acetonitrile/isopropanol/acetone. The LC method is shown in Table 1.
The mass spectrometer quantifier and qualifier selected-reaction monitoring
(SRM) transitions are shown in Table 2. The method range for all the analytes
was 10
–
750 ng/mL.
tem with
ole blood at various
e samples were spotted at a
yte was extracted by solvent
d transferred into clean vials
cted in Figure 2.
SpotDBS card with
standardsandQCs
Add200µL of IS inmethanol
Vortex for20 minutes
Extract solution from
wellsandadd500µL water
Punchcardwith
3mm holepunch
Placepunchedhole into96wellplate
FIGURE 2. Workflow of preparing the dried blood spot for LC/MS
FIGURE 3. Online sample cleanup and analytic separation flow path
TABLE 2. SRM transitions
Step Start
Sec
Flow
%A
%B
%C
1
0.00
40
1.5
100.0
-
-
2
0.67
65
0.20
-
100
-
3
1.75
5
0.20
-
100
-
4
1.83
120
1.20
-
-
100
5
3.83
30
1.10
-
-
100
6
4.33
60
1.50
100
-
-
Analyte
Precurs
or Ion
(Q1)
Product Ion
(Q3)
Amitriptyline
278.1
233.2
191.1
Doxepin
280.2
235.0
Imipramine
281.0
86.3
208.0
Fluvoxamine
319.1
200.0
228.0
Clomipramine
314.9
86.2
242.1
Fluoxetine
310.1
117.1
148.0
Paroxetine
330.1
192.0
151.0
Citalopram
325.1
109.1
262.0
Nortiptyline
264.1
233.0
191.0
Desipramine
267.1
208.1
236.1
Venlafaxine
278.2
147.1
121.1
Sertraline
306.0
275.0
158.9
Duloxetine
298.0
154.0
-
Bupropion
241.0
167.0
185.0
Amitriptyline-d
3
281.1
233.2
Doxepin-d
3
283.2
235.1
Fluoxetine-d
6
316.1
154.0
Paroxetine-d
6
336.1
198.1
Nortiptyline-d
3
267.1
233.1
Sertraline-d
3
309.0
275.0
TABLE 1. LC method parameters


