
Codeine
Y = 32.2427+24.0181*X
0
20000
40000
60000
80000
100000
120000
140000
160000
180000
200000
220000
240000
260000
Area
Morphine
Y = 55.5334+9.08022*X
0
2000
4000
6000
8000
10000
pg on column
0
2000
4000
6000
8000
10000
pg on column
0
2000
4000
6000
8000
10000
pg on column
0
2000
4000
6000
8000 10000
pg on column
0
10000
20000
30000
40000
50000
60000
70000
80000
90000
Area
Norcodeine
Y = 22.9221+11.7412*X
0
10000
20000
30000
40000
50000
60000
70000
80000
90000
100000
110000
120000
Area
6-Acetylmorphine
Y = 54.3108+35.5146*X
R^2 = 0.9961 W: 1/X
R^2 = 0.9974 W: 1/X
R^2 = 0.9967 W: 1/X
R^2 = 0.9965 W: 1/X
0
50000
100000
150000
200000
250000
300000
350000
Area
Conclusions
Rigorous simultaneous characterization
and quantification of a large number
of drugs and their metabolites in a
biological matrix can be performed in
a fast and robust LC-MS/MS method
using an LXQ linear ion trap mass
spectrometer. The superior sensitivity
and faster cycle time of the LXQ
makes this possible in a single chro-
matographic run, resulting in high
throughput analyses. High specificity
quantification was done using MS
3
data
which can reduce overall chemical
noise even if there is a co-eluting
isobaric interfering ion. Additional
compound confirmation was obtained
using Mass Frontier software, where
a high match score to a library search
provided enhanced confidence in the
compound identification.
Acknowledgements
The authors would like to thank Dr. C. Murphy
for her assistance and technical discussions.
C. Yang and R. Chen are acknowledged for
suggestion and advice.
References
1
Huestis, M.A.; Cone, E.J.; Wong, C.J.;
Umbricht,A.; Preston, K.L.
J. Anal. Toxicol.
2000, 24, 509-521
2
Dams, R.; Murphy, C.M.; Choo, R.E.;
Lambert,W.E.; De Leenheer, A.P.; Huestis, M.A.
Anal. Chem.
2003, 75, 798-804
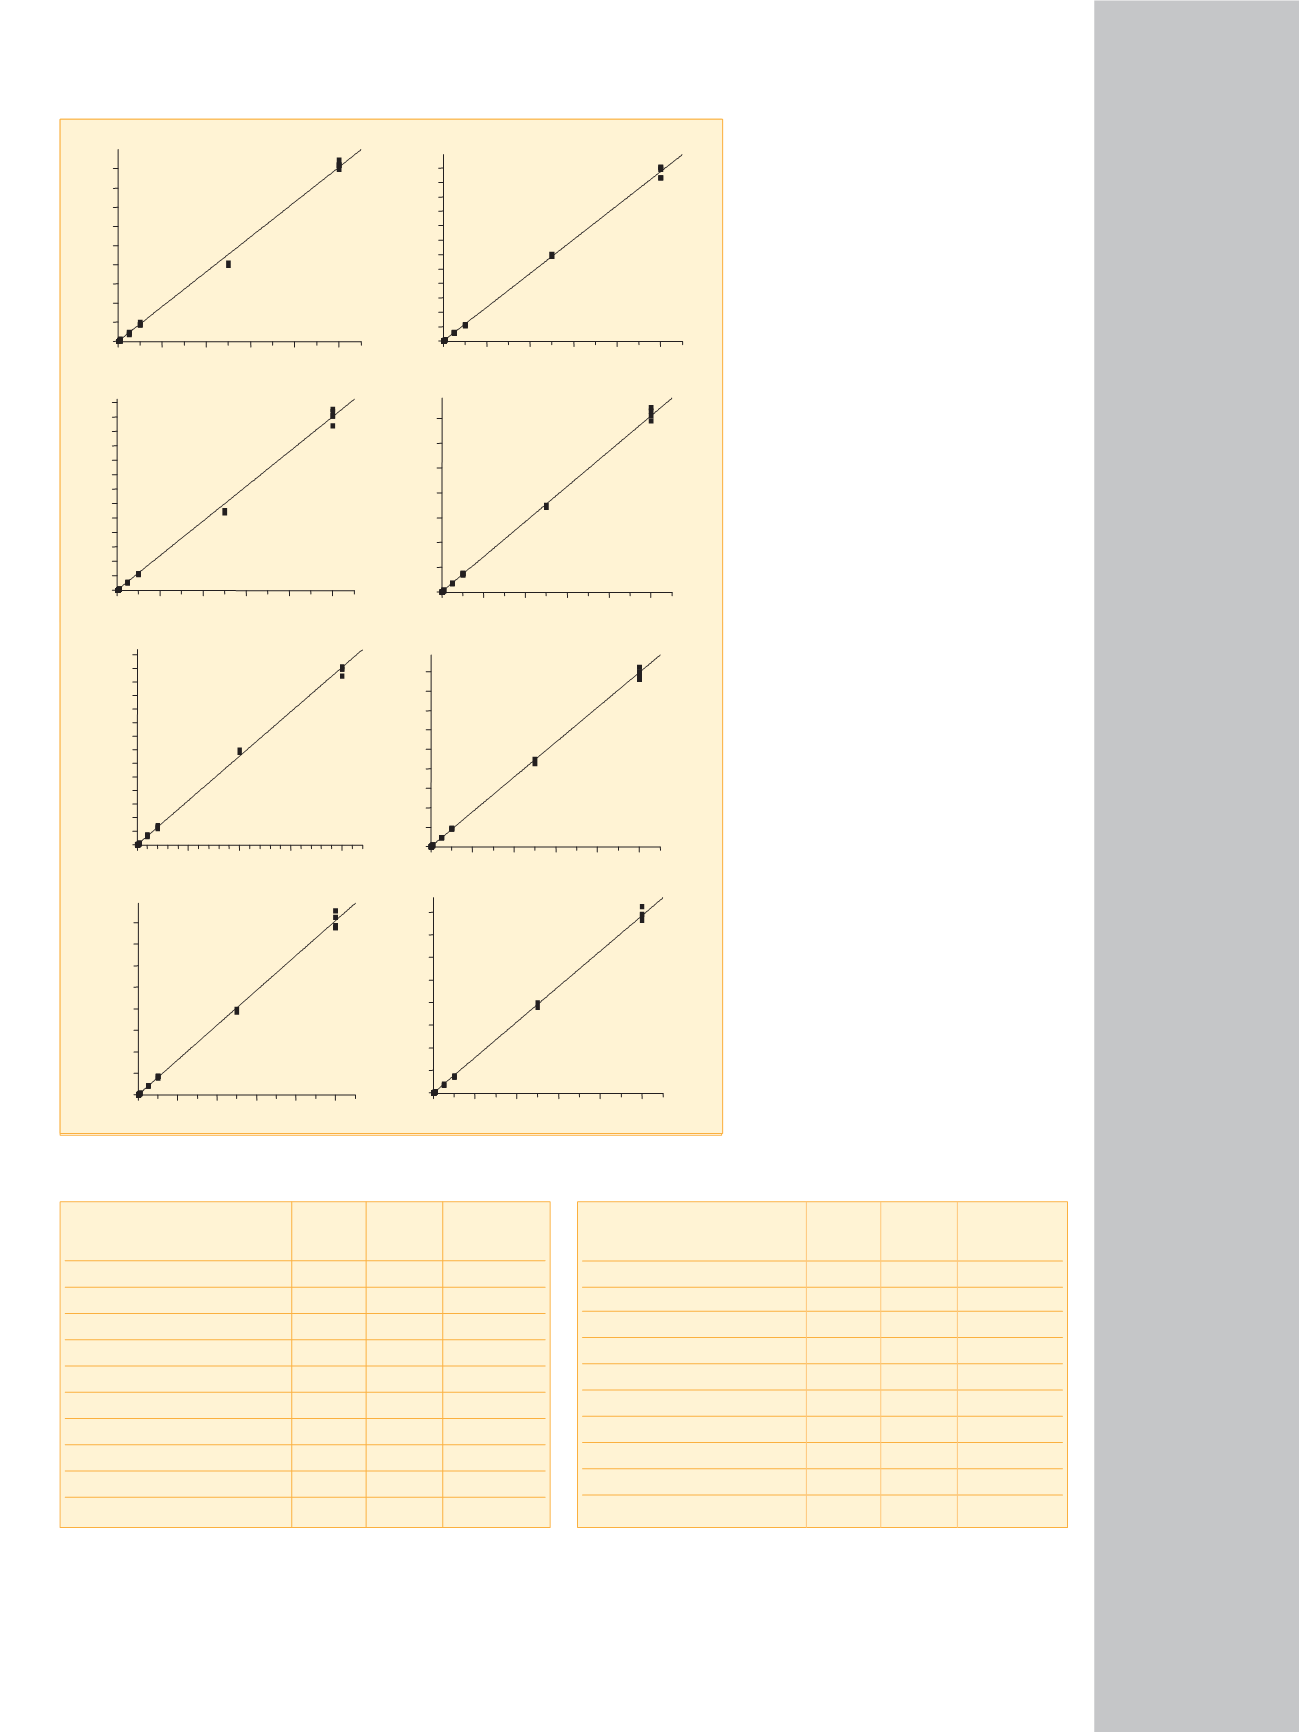
Figure 3: Representative calibration curves for eight drugs in oral fluid
Linear
LOD LOQ dynamic
Compound
(pg)
(pg)
range (pg)
Acetylcodeine
0.5
1
1-10000
Heroin
0.5
1
1-10000
Cocaine
0.5
1
1-10000
Norcocaine
0.5
1
1-10000
Cocaethylene
0.5
1
1-10000
Norcocaethylene
0.5
1
1-10000
Methadol
1
5
1-10000
EDDP
0.5
1
1-10000
Propoxyphene
1
5
5-10000
Methadone
0.5
1
1-10000
Linear
LOD LOQ dynamic
Compound
(pg)
(pg)
range (pg)
EEE
1
5
5-5000
Normorphine
5
10
10-10000
AEM
5
10
10-10000
Morphine
5
10
10-10000
Norcodeine
5
10
10-10000
Codeine
1
5
5-10000
6-Acetylmorphine
1
5
5-10000
m-Hydroxybenzoylecgonine
0.2
1
1-2000
Benzoylnorecgonine
0.2
1
1-2000
Benzoylecgonine
0.5
1
1-10000
Table 2: LOD (limit of detection), LOQ (limit of quantification) and linear dynamic range for analysis of 20 drugs and metabolites in oral fluid using the
LXQ linear ion trap mass spectrometer
Methadol
Y = 11.8893+7.8451*X
0
10000
20000
30000
40000
50000
60000
70000
80000
Area
Benzoylnorecgonine
Y = 1.83466+65.2358*X
0
500
1000
1500
2000
pg on column
0
10000
20000
30000
40000
50000
60000
70000
80000
90000
100000
110000
120000
130000
140000
Area
Norcocaethylene
Y = 15.9875+161.756*X
0
2000 4000 6000 8000 10000
pg on column
0
200000
400000
600000
800000
1000000
1200000
1400000
1600000
Area
Cocaethylene
Y = 22.1534+178.869*X
0
200000
400000
600000
800000
1000000
1200000
1400000
1600000
1800000
Area
0
2000 4000 6000 8000 10000
pg on column
0
2000 4000 6000 8000 10000
pg on column
R^2 = 0.9977 W: 1/X
R^2 = 0.9977 W: 1/X
R^2 = 0.9978 W: 1/X
R^2 = 0.9986 W: 1/X


