
In addition, the excellent ion statistics and the fast cycle
time of the LXQ linear ion trap mass spectrometer
enabled the simultaneous quantification and identification
of these analytes. Calibration curves based on MS/MS
spectra were generated using the standards for the drug
mixture spiked in oral fluid over a concentration range
from 50 fg/µL to 1.0 ng/µL. Figure 3 shows calibration
curves for 8 of the 20 compounds analyzed simultane-
ously. The R
2
values of these curves are better than 0.996
and they exhibit linear dynamic range over 3 to 4 orders
of magnitude. The detection limits (LOD and LOQ) for
each analyte in oral fluid are listed in Table 2 along with
the linear dynamic ranges. Compared with data published
previously
2
,
the LXQ linear ion trap provided up to 10
times lower detection limits and an increased linear
dynamic range.
Further confirmatory information and higher speci-
ficity results were also easily generated by performing
quantification based on MS
3
data. The use of MS
3
quan-
tification is demonstrated for the ecogonine ethyl ester
sample (EEE) which undergoes a neutral loss of water
molecule upon ion activation. When spiked in oral fluid,
interference from the matrix masked the analyte peak.
This was overcome as shown in Figure 4. The signal-to-
noise ratio (S/N) of the extracted ion chromatogram
obtained from MS
3
data (top chromatogram) is dramati-
cally higher than that obtained from the MS/MS data.
The high quality of the MS
n
spectra obtained using the
LXQ also results in greater sensitivity over a wider linear
dynamic range (Figure 4b and 4c).
The quantitative study was completed by analyzing
two QC oral fluid samples, each containing a mixture of
ten drugs. The results shown in Table 3 demonstrate a
high level of quantification accuracy, with a deviation of
less than 10% for all the analytes. In addition, excellent
reproducibility was demonstrated with the %RSD being
less than 9% for all the compounds within five injections.
Data Analysis
Mass Frontier
™
software includes a number of tools for
structure identification. The powerful search features and
database management make it valuable for identifying
drugs, metabolites and related compounds. A library of
target drugs can be easily searched. As an example, the
MS/MS spectrum obtained from 6-acetylmorphine in
oral fluid was searched against an NIST library using
Mass Frontier software. In addition to being the top hit
(Figure 5), the chromatographic elution time and the mass
of the precursor ion provide added degrees of confidence
for identification.
Parentmasses (
m/z
)
0.0 0.2 0.4 0.6 0.8 1.0 1.2 1.4 1.6 1.8 2.0 2.2 2.4 2.6 2.8 3.0 3.2 3.4 3.6 3.8 4.0
Time (min)
370.30
342.30
340.10
328.30
318.20
312.30
310.90
306.20
304.30
304.20
300.30
290.30
290.20
286.30
278.30
276.30
272.30
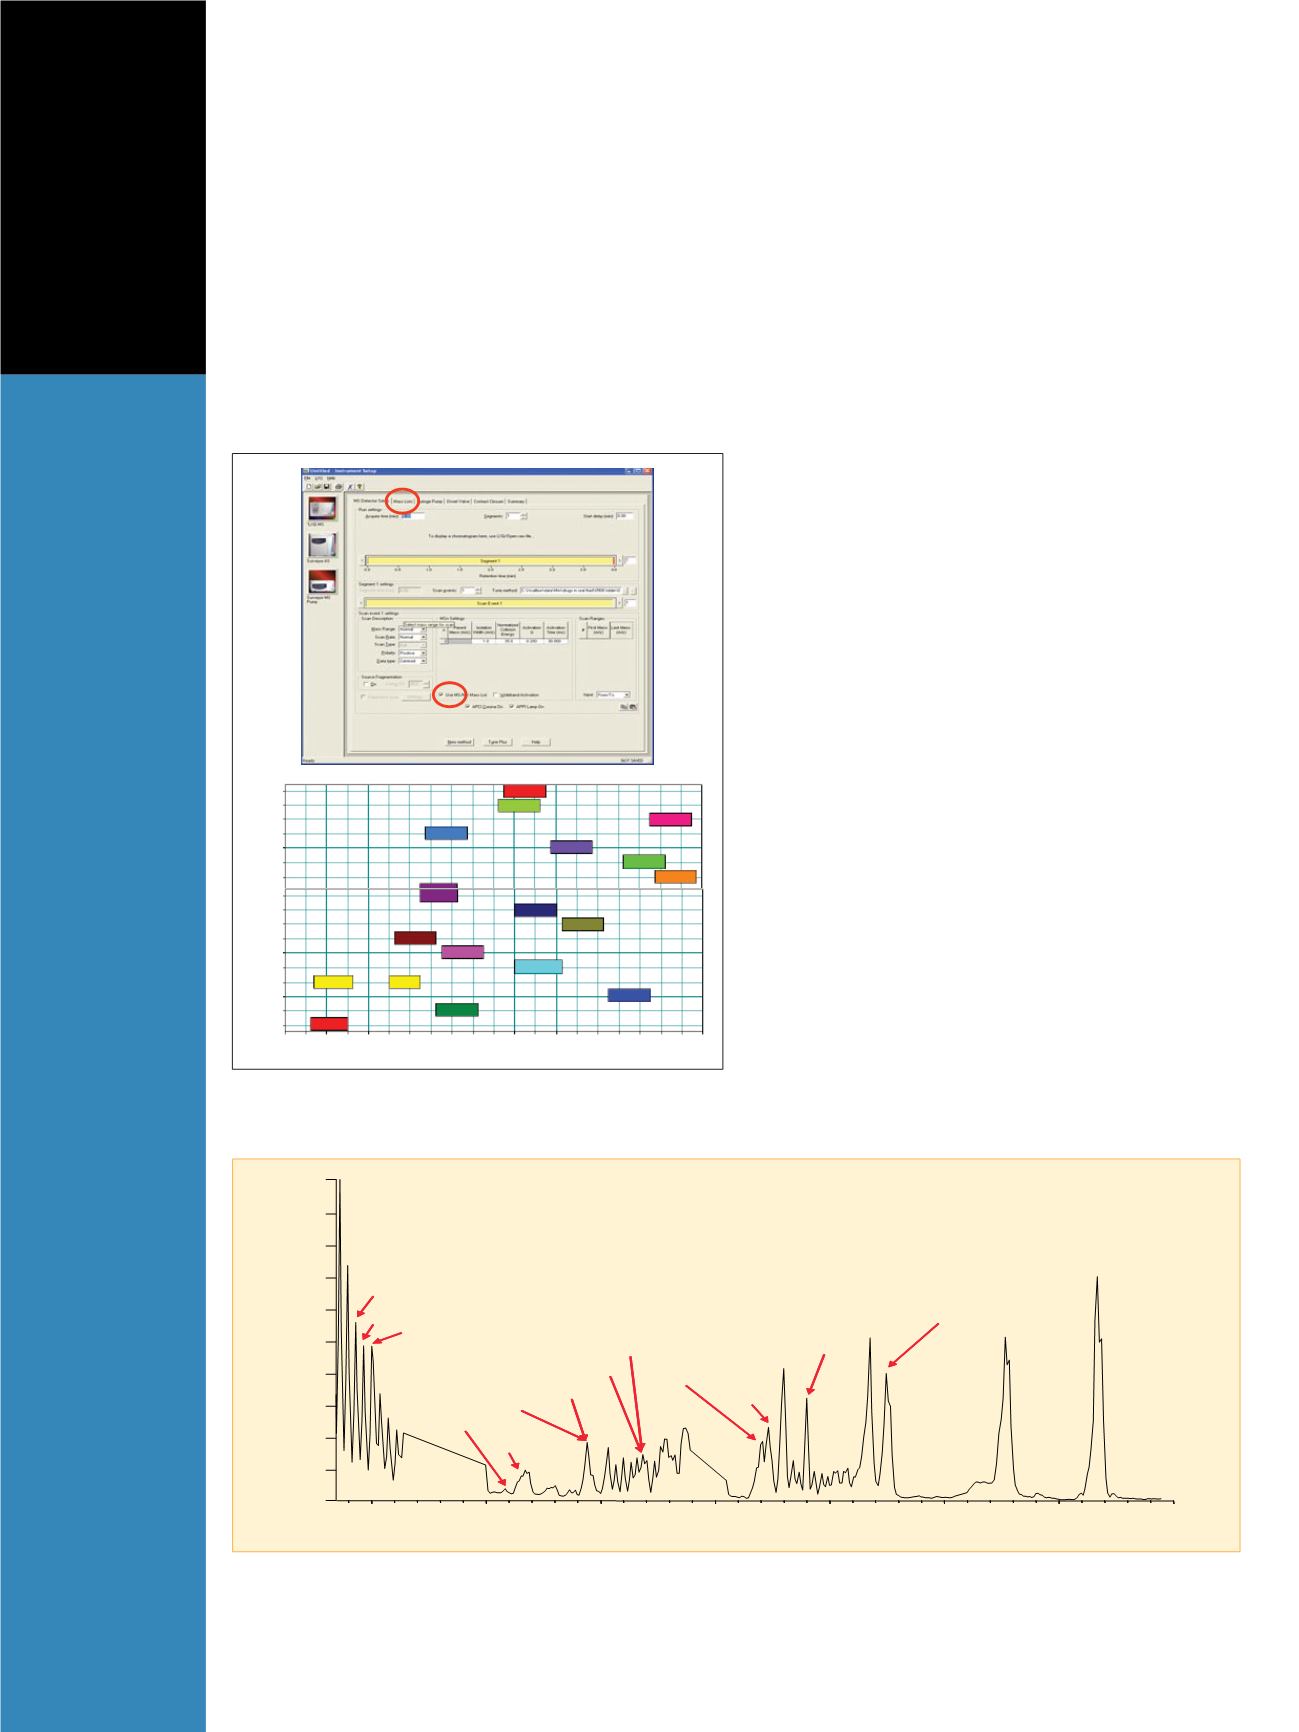
Figure 1: INTAMS (Intelligent Automated Mass Spectrometry) data acquisition
software setup for simultaneous analysis of 20 compounds
100
90
80
70
60
50
40
30
20
0.5
1.0
1.5
2.0
Time (min)
2.5
3.0
3.5
4.0
10
0
6-Acetylmorphine
Propoxyphene
Normorphine
AEM
Morphine
m-Hydroxybenzoylecgonine
Benzoylnorecgonine
Benzoylecgonine
EDDP
Norcocaethylene
Cocaethylene
Cocaine
Norcocaine
Acetylcodeine
Heroin
Codeine
Norcodeine
Methadol
Relative Abundance
Figure 2: Chromatogram of the drugs and metabolites in oral fluid using LC-MS/MS with INTAMS data acquisition software


