
A Quantitative Test for Multiple Classes of Illicit
Drugs and Their Primary Metabolites in Human
Biological Fluids by LC-MS/MS for Forensic Use
Kevin J. McHale,
1
Joyce Ho,
2
and Angela Springfield
2
1
Thermo Fisher Scientific, Somerset, NJ, USA;
2
Tarrant County Medical Examiner, Fort Worth, TX, USA
Application
Note: 390
Key Words
• TSQ Quantum
Discovery MAX
• Surveyor HPLC
• Forensic drugs
of abuse testing
• SRM
Introduction
Currently, GC/MS is the method of choice for quantifying
drugs of abuse. In recent years, however, many forensic
labs have been switching to LC-MS/MS methods, which
do not require time-consuming derivatization or extensive
sample cleanup necessary in GC/MS analyses. Yet, many
of the LC-MS/MS methods described in the literature
either assay a limited number of illicit drug classes or do
not include their primary metabolites
of these illicit drugs (see table 1).
1-5
Herein is described a
method to assay multiple drugs of abuse including opiates,
stimulants, depressants, and the primary metabolites of
these illicit drugs.
Goal
To apply a single LC-MS/MS method to screen for 32
illicit drugs of abuse and their metabolites in biological
fluids.
Experimental Conditions
Sample Preparation
Whole blood or urine samples (0.1–0.4 mL) were spiked
with 20 ng of isotopically labeled internal standards and
purified by solid phase extraction (SPE). Extracted
samples were reconstituted to yield solutions with the
internal standards at 25 ng/mL.
HPLC
HPLC analysis was performed using the Thermo
Scientific Surveyor HPLC System. Each 10 µL sample
was injected directly onto a Thermo Scientific Hypersil
GOLD PFP 50
×
2.1 mm, 3 µm analytical column.
A gradient LC method used mobile phases A (0.1%
formic acid in water) and B (0.1% formic acid in
acetonitrile) at a flow rate of 0.3 mL/min.
Mass Spectrometry
MS analysis was carried out on a Thermo Scientific
TSQ Quantum Discovery MAX triple stage quadru-
pole mass spectrometer with an electrospray ionization
(ESI) probe. The MS conditions were as follows:
Ion source polarity: Positive ion mode
Ion transfer tube temperature: 370°C
Scan Type: SRM
SRM scan time: 10 ms per transition
Q1, Q3 resolution: unit (0.7 Da FWHM)
Two SRM transitions were monitored for each
component to provide ion ratio confirmations (IRC).
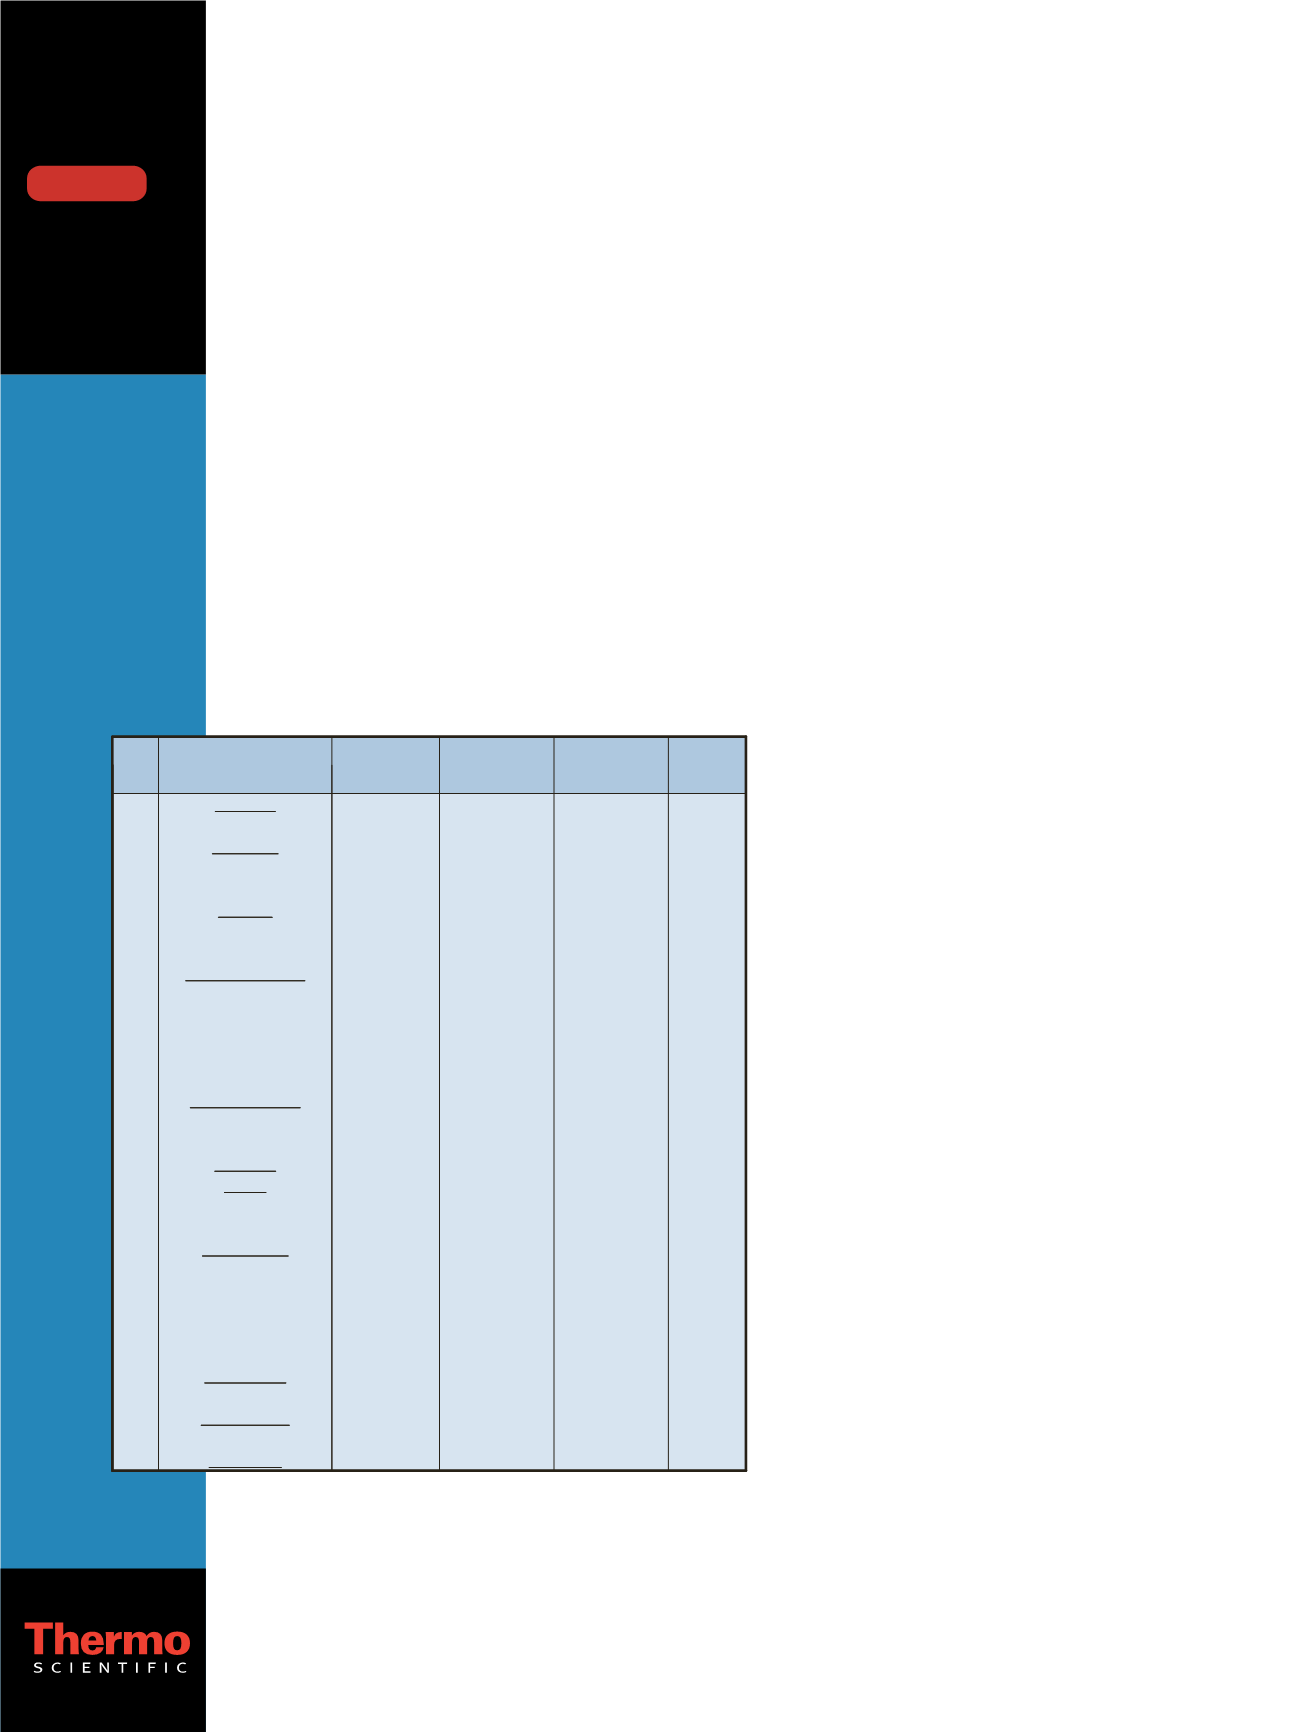
Table 1 summarizes these SRM transitions.
Ra o
EE
DD
CC
BB
AA
Z
Y
X
W
V
U
T
S
R
Q
P
O
N
M
L
K
J
I
H
G
F
E
D
C
B
A
18
105
265
310
Methadone
34
239
268
314
Flunitrazepam
15
82
196
318
Cocaethylene
70
154
193
285
Diazepam
28
214
270
316
Clonazepam
11.8
177
255
301
Temazepam
85
205
281
309
Alprazolam
38
180
236
282
Nitrazepam
25
229
275
321
Lorazepam
11.1
82
182
304
Cocaine
82
208
140
271
Nordiazepam
54
269
241
287
Oxazepam
55
174
220
248
Meperidine
32
135
163
208
MDEA
40
179
125
238
Ketamine
30
135
163
194
MDMA
52
227
135
284
7-amino-flunitrazepam
24
105
168
290
Benzoylecgonine
28
171
199
300
Hydrocodone
43
179
125
224
Norketamine
68
211
165
328
6-MAM
92
105
135
180
MDA
65
256
241
316
Oxycodone
67
119
91
150
Methamphetamine
97
227
187
302
Noroxycodone
85
250
222
286
7-amino-clonazepam
97
215
165
300
Codeine
86
91
119
136
Amphetamine
56
157
185
286
Hydromorphone
95
133
115
166
Ephedrine
14.5
94
121
252
7-amino-nitrazepam
87
165
201
286
Morphine
Qualifier
Parent
m
/
z
Drug of Abuse
FF
Ion
ti
Quantifier
Product
m/z
Product
m/z
Table 1: Summary of SRM transitions for 32 illicit drugs.
DOWNLOAD


