
Results and Discussion
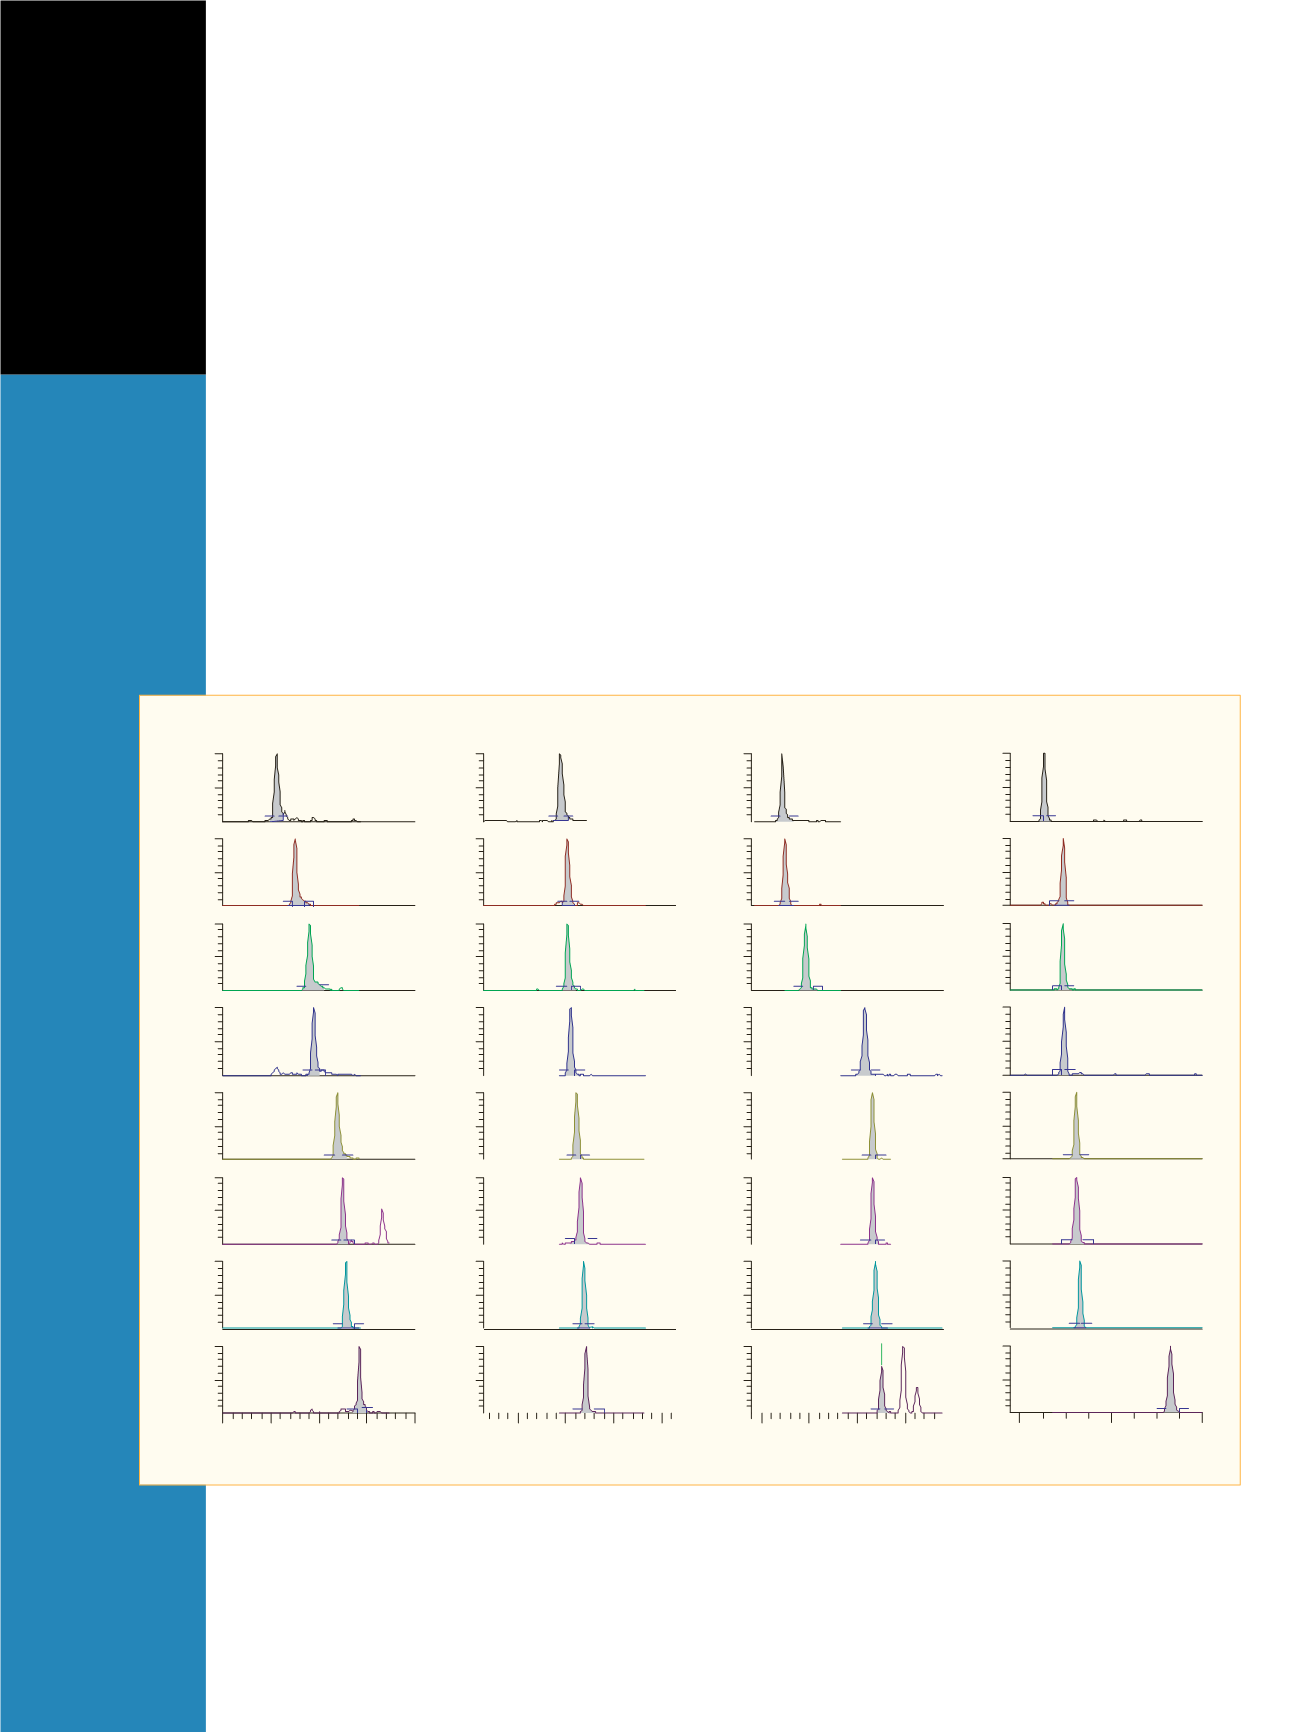
Figures 1 and 2 demonstrate the separation of 32 illicit
drugs in less than 10 minutes. Using an SRM dwell time
of 10 ms per transition yielded a minimum of 15 data
points across an LC peak. The limits of quantitation
(LOQs) were determined as either 0.5 ng/mL (lowest cali-
brator concentration used) or as the concentration where
the percent relative errors and %CVs were less than 20%
for five replicate injections.
As shown in Figure 3, most calibration curves were
fit using linear regression. Some standards (for example,
cocaine) yielded better statistical calibration curves using
quadratic regression. In these select cases, the target
compound used a structurally different isotopically labeled
internal standard (for example, cocaine used D5-nor-
diazepam as internal standard).
The assay of biological sample extracts identified
multiple drugs of abuse and related metabolites. Figures
4A and B demonstrate examples of urine and whole blood
extracts assayed for the presence of illicit drugs with the
developed LC-MS/MS method. Note that cocaine and
benzoylecgonine were detected and qualified below the
assay LOQs in a whole blood extract (Figure 4B), indi-
cating that lower LOQs are possible for these compounds.
Conclusion
An LC-MS/MS method for assaying illicit drugs and their
metabolites at an LOQ of 0.5–2.5 ng/mL in biological
fluids for forensic use has been demonstrated.
Confirmation of the drugs of abuse was achieved by moni-
toring two SRM transitions per compound and measuring
their area ratios to within ±20%. Utilizing a low SRM
dwell time of 10 ms per transition to achieve sufficient
data points across a chromatographic peak had no adverse
effects, such as SRM cross-talk, on the quantitation and
confirmation of these illicit drugs. To authenticate this
assay, extracts from biological fluids were analyzed,
showing the presence of several drugs of abuse and their
metabolites.
:TR
00.01 - 08.5
:MS
G5
6
8
01
)nim( emiT
05
001
05
001
05
001
0
05
001
05
001
05
001
05
001
05
001
277529 :AA
419593 :AA
9980771 :AA
462729 :AA
565898 :AA
0865799 :AA
0848161 :AA
98302051 :AA
:TR
00.5 - 00.1
:MS
G5
1
2
3 4
5
)nim( emiT
05
001
05
001
05
001
05
001
05
001
RelativeAbundance
05
001
05
001
05
001
893932 :AA
3130902 :AA
054287 :AA
751529 :AA
3782942 :AA
970633 :AA
868769 :AA
821183 :AA
:TR
08.7 - 08.3
:MS
G5
4 5
6
7
)nim( emiT
05
001
05
001
05
001
05
001
05
001
05
001
05
001
05
001
6352445 :AA
3488331 :AA
7373258 :AA
2039544 :AA
5804561 :AA
648246 :AA
4259048 :AA
874866 :AA
:TR
03.6 - 03.2
:MS
G5
3 4
5
6
)nim( emiT
05
001
05
001
05
001
05
001
05
001
05
001
05
001
05
001
0152373 :AA
917698 :AA
303059 :AA
829559 :AA
2512231 :AA
8947312 :AA
8547522 :AA
3451031 :AA
5.2 = QOL
5.0 =QOL
A
0.1 = QOL
B
C
D
E
F
G
H
I
J
K
L
M
N
O
P
Q
R
S
T
U
V
W
X
FF
Y
Z
BB
EE
CC
DD
AA
0.1 = QOL
0.1 = QOL
0.1 = QOL
0.1 = QOL
0.1 = QOL
0.1 = QOL
0.1 = QOL
5.0 = QOL
5.2 = QOL
5.2 = QOL
0.1 = QOL
0.1 = QOL
0.1 = QOL
5.0 = QOL
5.0 = QOL
0.1 = QOL
0.1 = QOL
5.0 = QOL
5.0 = QOL
5.0 = QOL
5.0 = QOL
5.0 = QOL
0.1 = QOL
0.1 = QOL
0.1 = QOL
0.1 = QOL
0.1 = QOL
5.0 =QOL
5.0 =QOL
Figure 1: Quantifier SRM transitions for the 2.5 ng/mL standard. For the compound designators, refer to the legend in Table 1.


