
6
Lower Limit of Quantitation and Linear Range
The lower limit of quantitation (LLOQ), linearity, and ion
ratio test parameters for the 19 drugs are summarized in
Table 5. For calibration curves, a linear fit with 1/X
weighting was used. The LLOQ for these 19 drugs were
determined to be between 4 and 20 ng/mL. The method
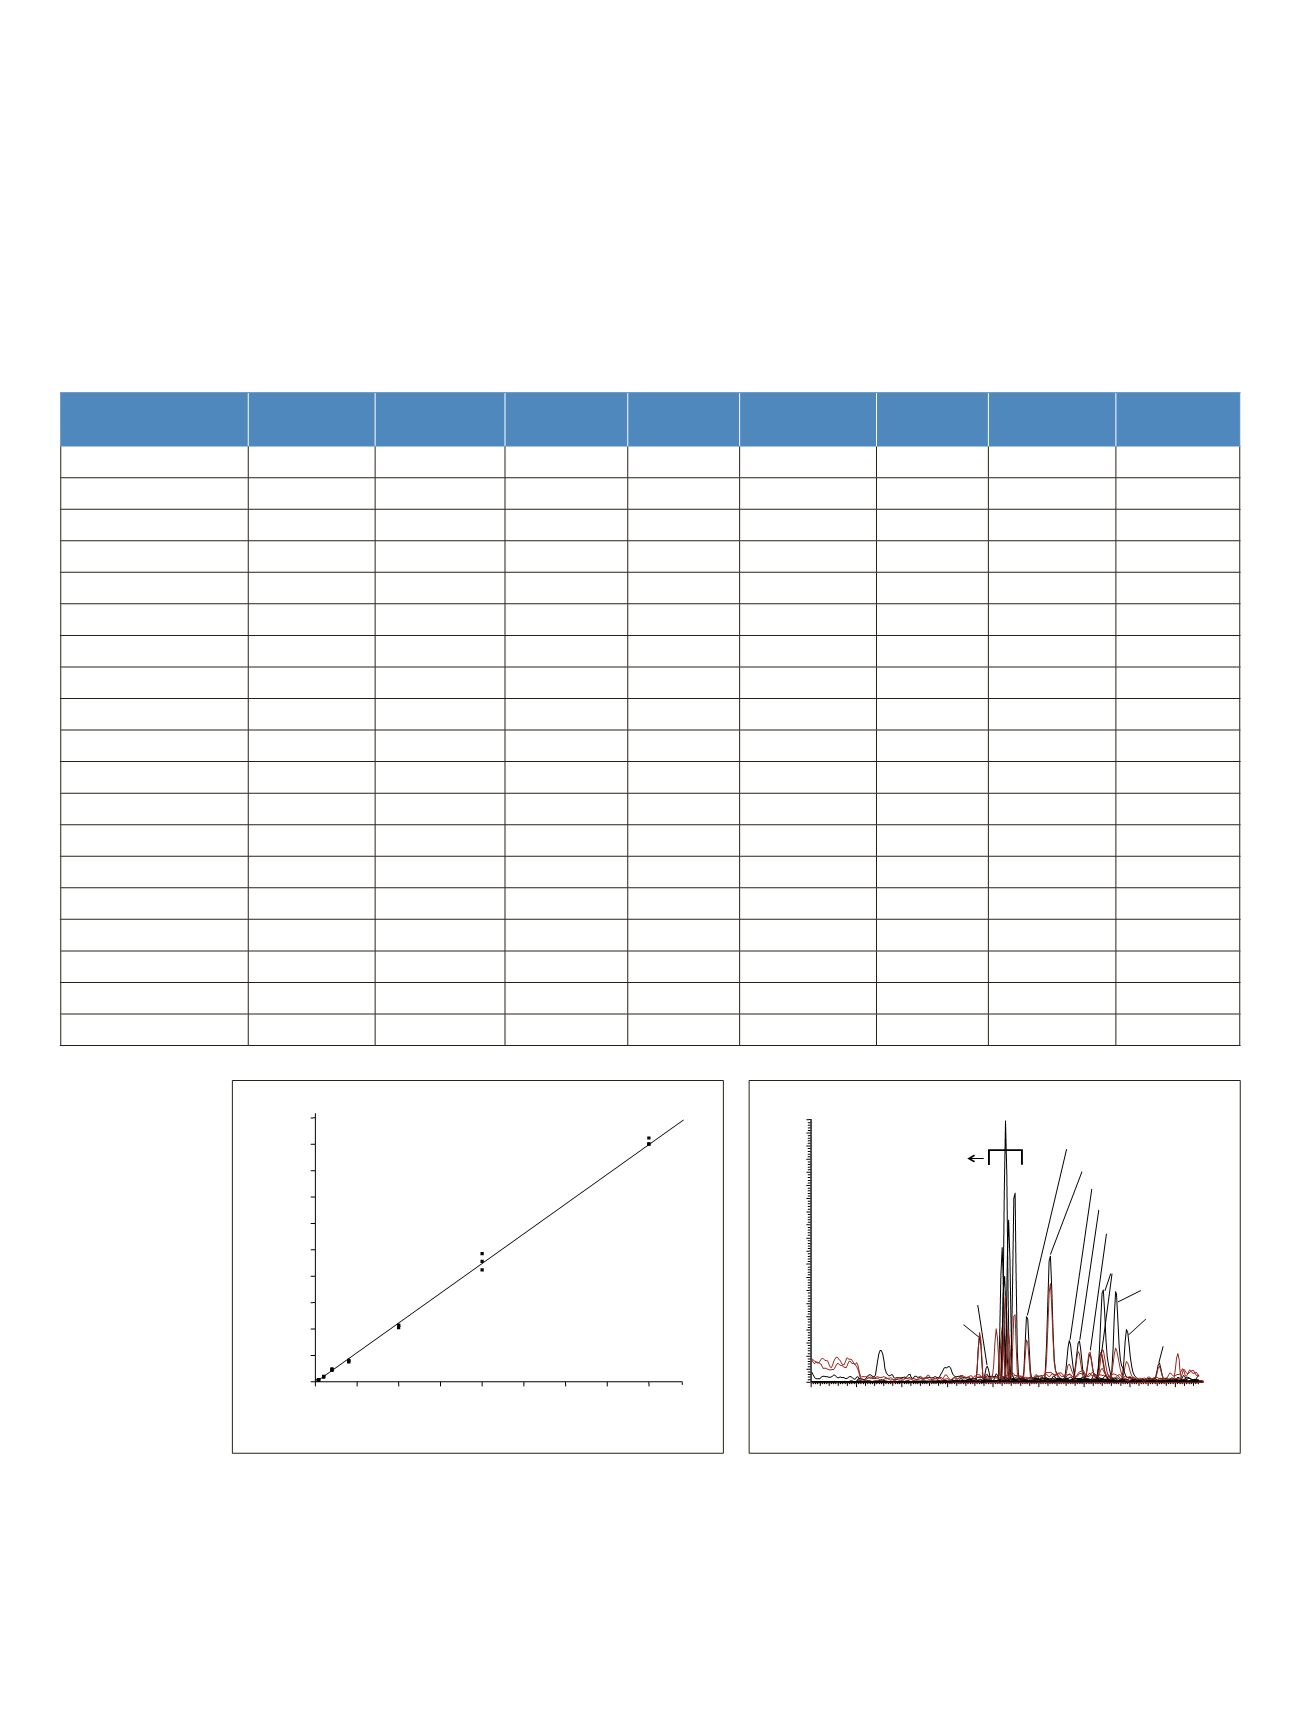
was linear to 400 ng/mL for all the drugs. Figure 3 shows
the calibration curve of clozapine in CSS. Figure 4 shows
the overlaid SRM chromatograms (quantifier and
qualifier) of all the 19 drugs at 20 ng/mL in CSS.
Table 5. LLOQ and linearity summary for 19 drugs
Analyte
Precursor
Ion (
m/z
)
Quantifier
Ion (
m/z
)
Qualifier
Ion (
m/z
)
Ion Ratio
(%)
Ion Ration
Window (±%)
LLOQ
(ng/mL)
Linear Range
(ng/mL)
R
2
Amitriptyline
278.10
202.10
233.10
105
21
4
4–400
0.9941
Bromazepam
316.11
182.10
209.10
90
18
10
10–400
0.9955
Clobazam
301.10
259.10
224.10
37
7
10
10–400
0.9967
Clomipramine
315.10
86.00
58.00
35
7
4
4–400
0.9933
Clonazepam
316.00
270.10
214.00
35
7
10
10–400
0.9960
Clozapine
327.10
270.10
192.00
70
14
4
10–400
0.9974
Diazepam
285.10
193.10
154.00
67
13
4
4–400
0.9951
Dothiepin
296.10
202.10
221.10
84
17
10
10–400
0.9937
Doxepin
280.10
165.10
107.00
180
36
4
4–400
0.9955
Flunitrazepam
314.10
268.10
239.10
39
8
4
4–400
0.9973
Imipramine
281.20
86.00
58.00
35
7
4
4–400
0.9972
Lamotrigine
256.00
211.00
109.00
50
10
10
10–400
0.9881
Levetiracetam
171.10
126.10
98.10
4.6
2
10
10–400
0.9945
Nitrazepam
282.10
236.10
207.10
35
7
4
4–400
0.9980
Nortriptyline
264.20
233.20
91.10
73
15
4
4–400
0.9948
Oxazepam
287.10
269.10
104.10
13
4
10
10–400
0.9943
Perhexilline
278.20
95.10
67.00
66
13
20
20–400
0.9755
Temazepam
301.11
255.10
283.10
25
5
4
4–400
0.9948
Trimipramine
295.20
100.10
58.10
44
9
4
4–400
0.9968
Clozapine
0
100
200
300
400
0
2
4
6
8
10
Area Ratio
Concentration (ng/mL)
Y=-0.02607+0.02253*X
R
2
=0.9974 weighting=1/X
0
1
2
3
4
5
6
7
8
Time (min)
0
20
40
60
80
100
Relative Abundance
Levetiracetam
Perhexilline
Bromazepam
Clomipramine
Trimipramine
Amitriptyline and
Imipramine
Nortriptyline
Doxepin
Dothiepin
Clozapine
Lamotrigine
Diazepam
Clonazepam
Oxazepam
Nitrazepam
Clobazam
Temazepam
Flunitrazepam
Figure 3. Calibration curve of clozapine in CSS
Figure 4. SRM chromatograms of all 19 drugs at 20 ng/mL in CSS
after 200-fold dilution


