
3
100 ng/mL
a
500 ng/mL
a
Analyte
Recovery
(%)
Average
(%, n=12
b
)
Standard Deviation
(%, n=12)
Average
(%, n=12)
Standard Deviation
(%, n=12)
Morphine
Absolute
76.4
6.8
78.6
5.4
Relative
92.1
10.9
96.1
9.6
Codeine
Absolute
86.5
6.0
89.7
6.2
Relative
88.7
10.6
95.6
8.2
Hydromorphone
Absolute
74.4
7.1
73.2
6.6
Relative
92.8
8.1
89.9
7.0
Hydrocodone
Absolute
82.6
9.0
71.8
6.7
Relative
101.9
17.1
83.6
13.4
Oxymorphone
Absolute
57.5
7.6
57.9
7.0
Relative
103.7
17.8
103.0
15.1
Oxycodone
Absolute
63.4
9.9
68.7
8.1
Relative
90.6
8.5
103.8
8.5
Table 2. Summary of recoveries with 500-fold dilution
a
Two levels of spiked opioids concentrations were tested.
b
Twelve different individual urine lots were tested and compared to water samples (n=2).
Lower Limit of Quantitation (LLOQ), Dynamic
Range, and Accuracy
Blank human urine samples were spiked with the six
opioids and their IS. Concentrations of the opioids
ranged from 20 to 5000 ng/mL. At each concentration
level, three individually processed replicates were tested.
The concentration of IS was 100 ng/mL for all samples.
Linearity samples were analyzed in triplicate along with
one set of calibrators, which were also prepared in blank
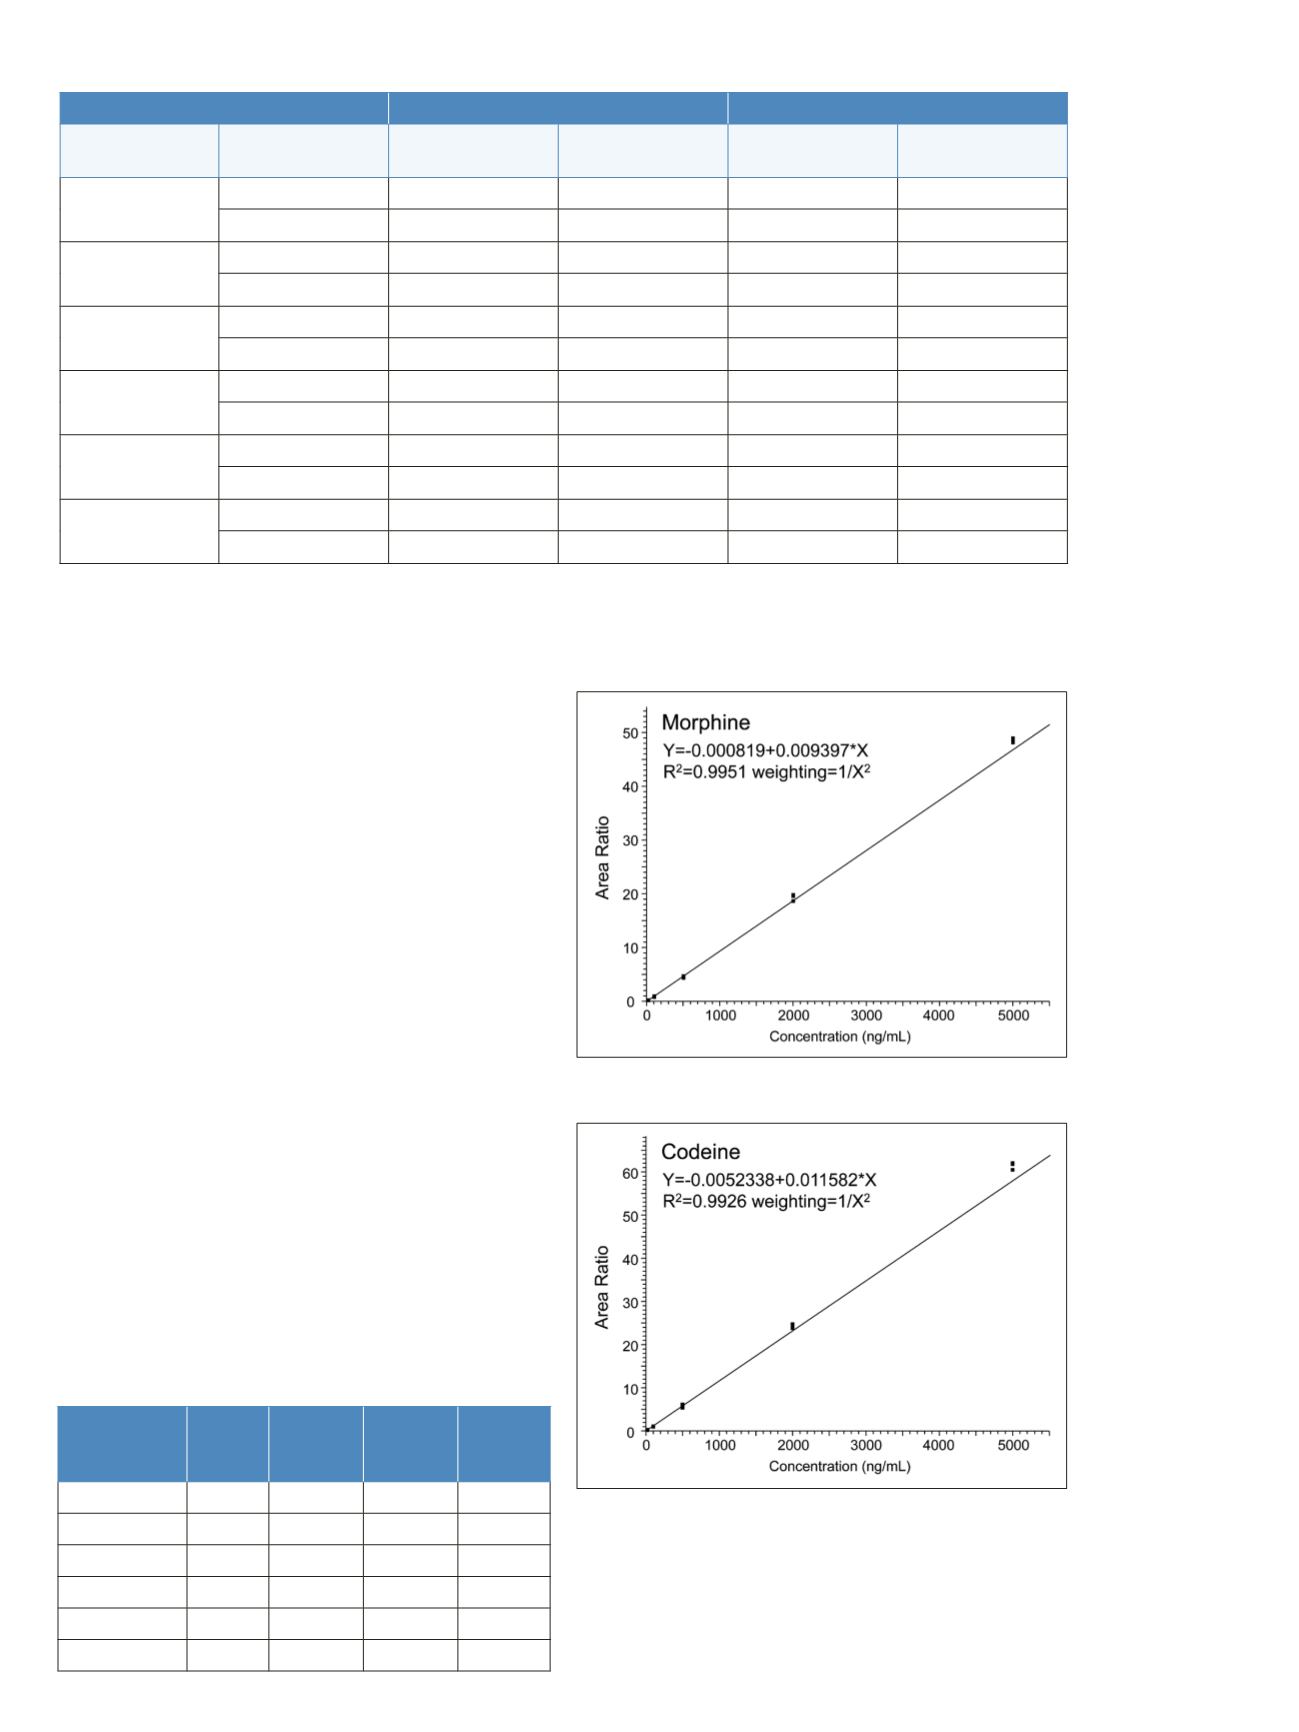
human urine. The calibration curves for morphine and
codeine (Figures 4 and 5) were constructed by plotting
the analyte/IS peak area ratio vs. analyte concentration.
The linearity was determined to be 20 to 5000 pg/mL for
all six opioids. The LLOQ for the six opioids were
determined to be 20 ng/mL. At LLOQ, the accuracy (n=3)
ranged from 99.2% to 115.5% for the six opioids and the
precision (n=3) ranged from 3.9% to 8.8% (Table 3).
Within the linear range, the accuracies (at higher than
LLOQ levels) were within 11.2% for the six opioids (data
not shown). Figures 4 and 5 show the calibration curves
for morphine and codeine. Figure 6 shows the SRM
chromatograms of the six opioids at their LLOQ in spiked
human urine. The signal-to-noise ratios for all six opioids
at their LLOQs were excellent.
Analyte
LLOQ
(ng/mL)
Linear
range
(ng/mL)
Accuracy
at LLOQ
(%, n=3)
Precision
at LLOQ
(%, n=3)
Morphine
20
20-5000
100.8
6.1
Codeine
20
20-5000
102.1
6.9
Hydromorphone
20
20-5000
115.5
8.8
Hydrocodone
20
20-5000
99.2
3.9
Oxymorphone
20
20-5000
102.3
6.2
Oxycodone
20
20-5000
107.4
4.4
Table 3. LLOQ, linear range and accuracy for the six opioids in urine
Figure 4. Calibration curve of morphine in human urine
Figure 5. Calibration curve of codeine in human urine


