
5
Method precision was also assessed with spiked human
urine samples at low and high quality control (QC)
concentrations of 20 and 200 ng/mL, respectively (Table 2).
Precision values at low (20 ng/mL) and high (200 ng/mL)
quality control concentrations ranged between 1.1% and
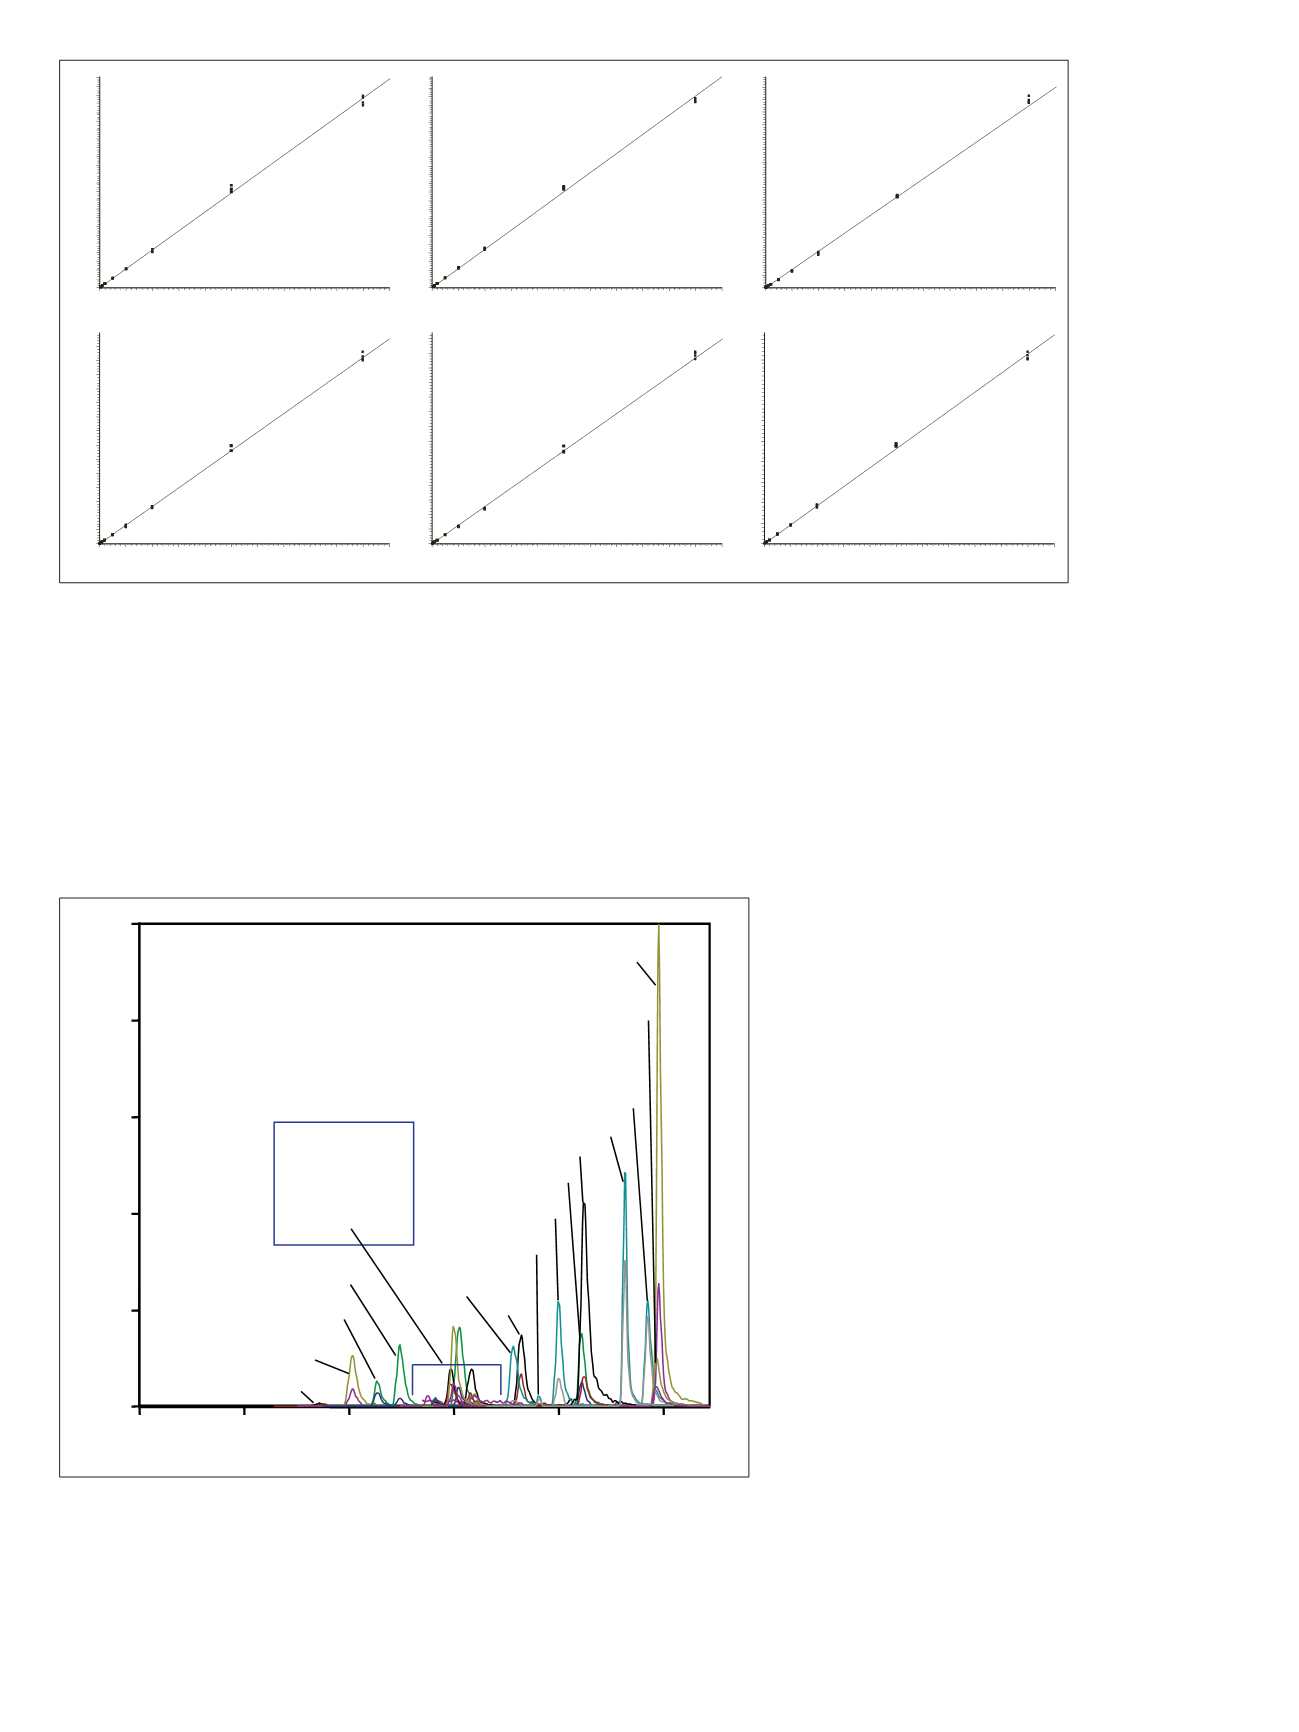
10.9% (Table 2). Figure 2 shows both the quantifier and
qualifier SRM chromatograms of 20 selected pain
management drugs spiked at 20 ng/mL in human urine.
7-Aminoclonazepam
0
100
200
300
400
500
600
700
800
900
1000
1100
0.0
0.2
0.4
0.6
0.8
1.0
1.2
1.4
1.6
1.8
2.0
2.2
2.4
2.6
2.8
3.0
3.2
3.4
3.6
3.8
4.0
4.2
4.4
4.6
4.8
Area Ratio
Concentration (ng/mL)
0
100
200
300
400
500
600
700
800
900
1000
1100
0.0
0.2
0.4
0.6
0.8
1.0
1.2
1.4
1.6
1.8
2.0
2.2
2.4
2.6
2.8
3.0
3.2
3.4
3.6
3.8
4.0
4.2
4.4
4.6
4.8
Benzoylecogonine
Concentration (ng/mL)
Area Ratio
0
100
200
300
400
500
600
700
800
900
1000
1100
0
1
2
3
4
5
6
7
8
9
10
11
12
13
14
15
16
Fentanyl
Concentration (ng/mL)
Area Ratio
0
100
200
300
400
500
600
700
800
900
1000
1100
0
1
2
3
4
5
6
7
8
9
10
11
12
13
14
Hydrocodone
Concentration (ng/mL)
Area Ratio
0
100
200
300
400
500
600
700
800
900
1000
1100
0
1
2
3
4
5
6
7
8
9
10
11
12
13
14
Midazolam
Concentration (ng/mL)
Area Ratio
0
100
200
300
400
500
600
700
800
900
1000
1100
0.0
0.5
1.0
1.5
2.0
2.5
3.0
3.5
4.0
4.5
5.0
Morphine
Concentration (ng/mL)
Area Ratio
Figure 1. Calibration curves of six selected drugs in spiked human urine
Figure 2. SRM chromatograms of 20 selected drugs at 20 ng/mL in spiked human urine
0.0
1.0
2.0
3.0
4.0
5.0
Time (min)
0
20
40
60
80
100
Relative Abundance (%)
Methadone
EDDP
PCP
Fentanyl
Cocaine
Meperidine
MDEA
Carisprodol
MDMA
Methamphetamine
Oxymorphone
Hydromorphone
Codeine
6-MAM
Benzoylecgonine
Oxycodone
Hydrocodone
MDA
7-Aminonitrazepam
Morphine


