


 294 / 302

4
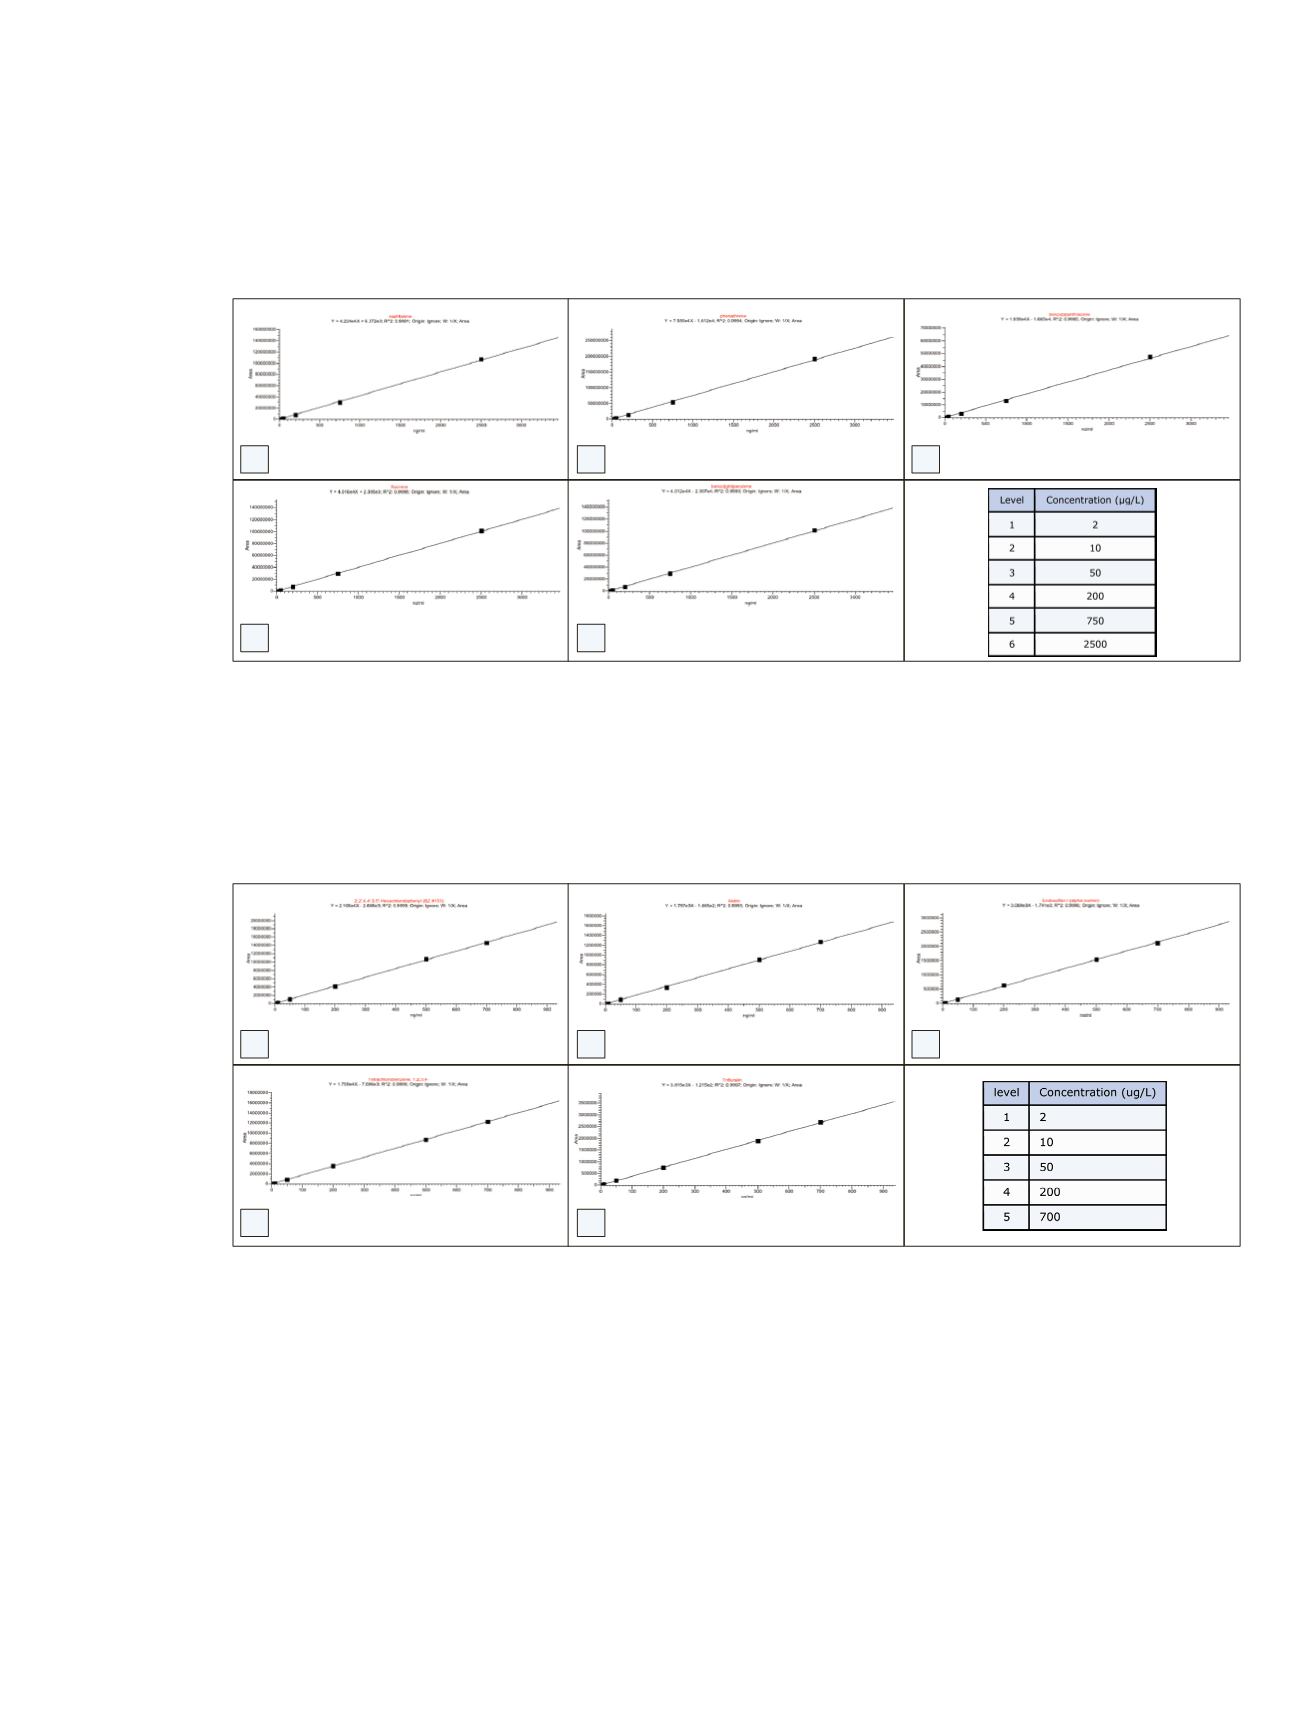
Calibration Curves
Calibration curves were produced in the range of 2 µg/L
to 700 µg/L for the OCPs and PCBs. A higher range,
2 µg/L to 2,500 µg/L, was necessary for the PAHs. The
curves were not corrected for internal standard calibration.
All curves had a regression coefficient higher than 0.995.
Curves for a selection of target compounds are plotted in
Figures 3 & 4.
a: naphthalene with R
2
=0.9991
b: phenanthrene with R
2
= 0.9994
c: benzo(a) anthracene with R
2
= 0.9985
d: fluorene with R
2
= 0.9998
e: benzoperylene with R
2
= 0.9993
a: PCB153 with R
2
=0.9999
b: aldrin with R
2
= 0.9993
c: alpha endosulfan with R
2
= 0.9996
d: tetrachlorobenzene with R
2
= 0.9999
e: trifluralin with R
2
= 0.9999
a
d
b
e
c
a
d
b
e
c
Figure 3: Calibration curves of various PAHs. The compounds and their respective regression coefficients were:
Figure 4: Calibration curves of various pesticides. The compounds and their respective regression coefficients were: