
5
Compounds at 2 µg/L level
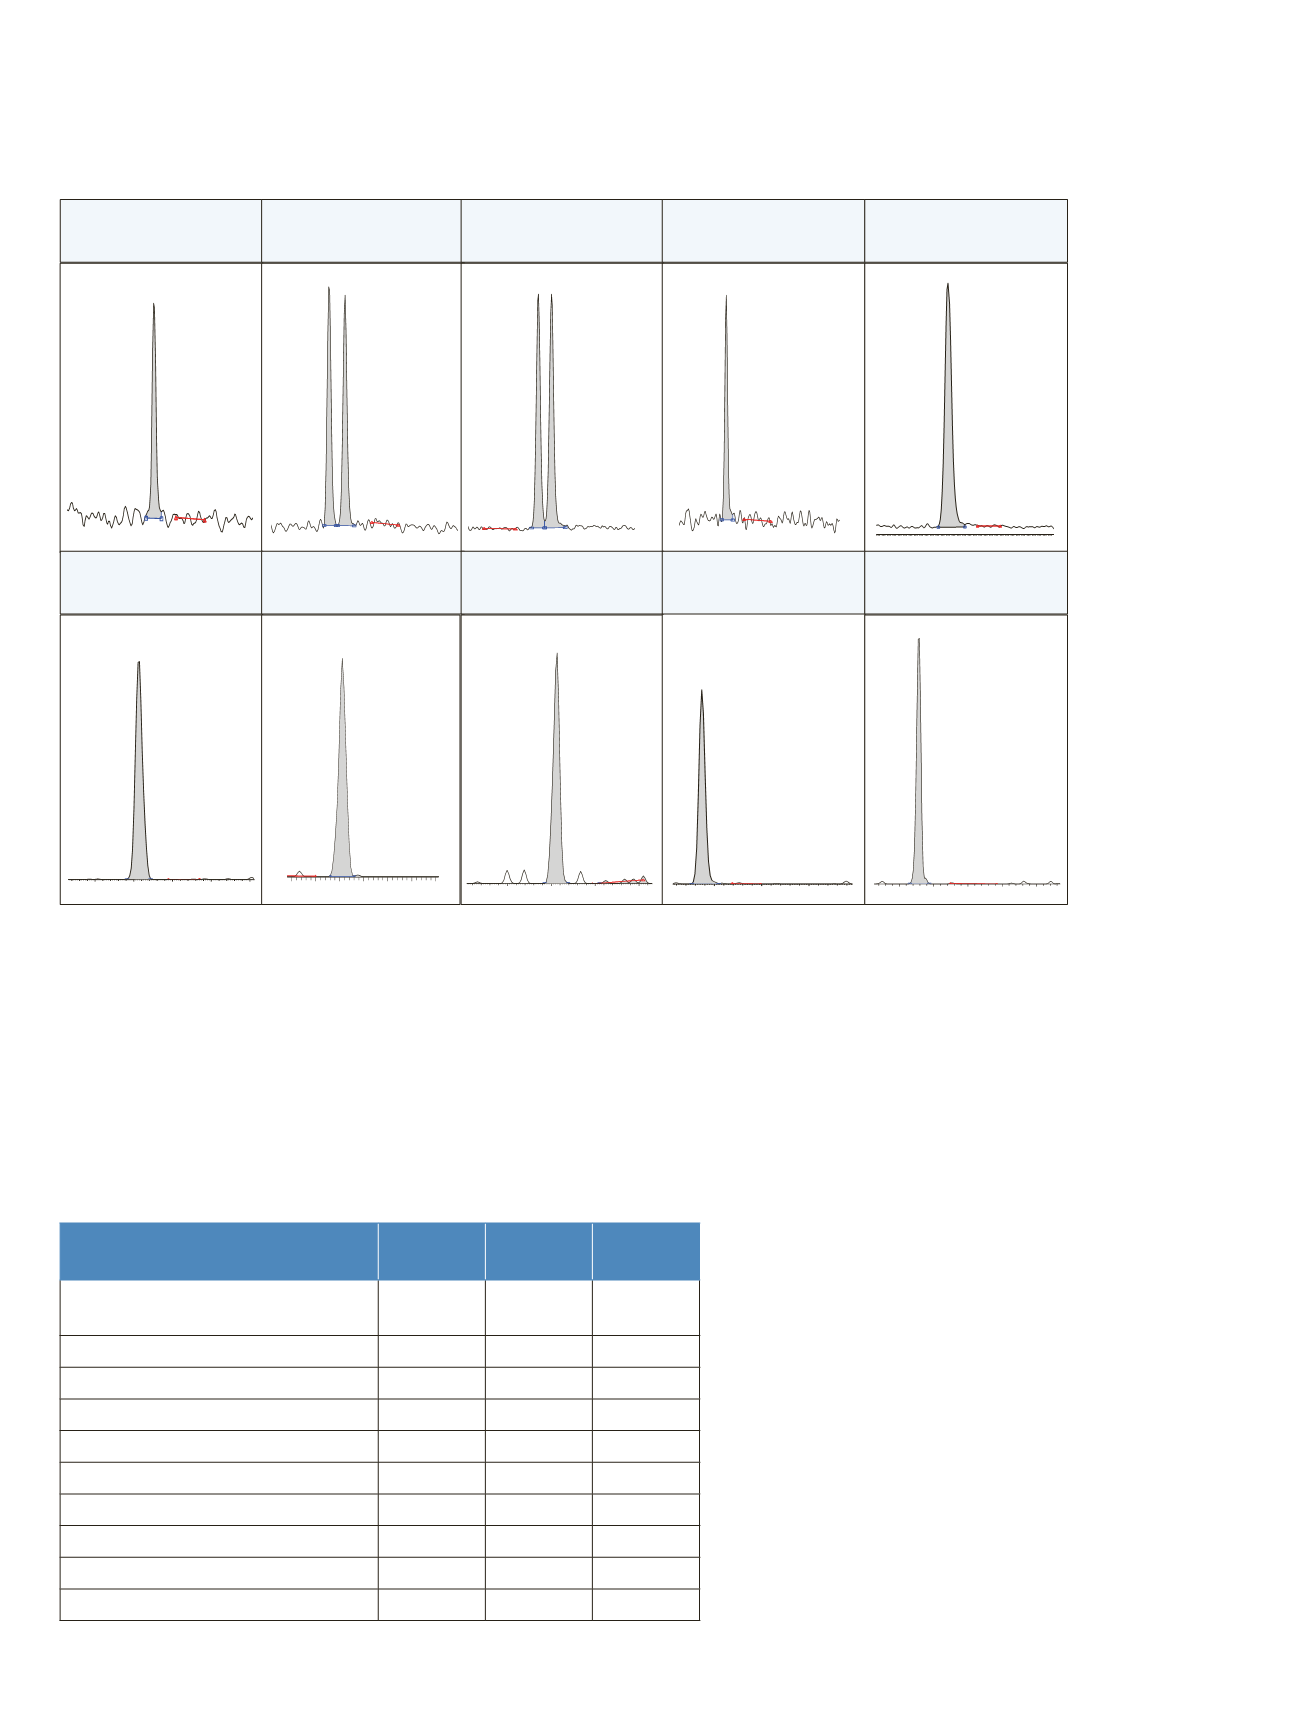
At the lowest calibrated level (2 µg/L or 2 pg on column),
all compounds gave excellent responses and high signal-
to-noise values. A selection of extracted SRM
chromatograms at this level are given in Figure 5.
Precision in Spiked Matrix Samples
In all three matrices, the repeatability was established by
performing repeat injections of spiked soil extracts, spiked
water extracts, and spiked building material extracts. All
samples were analyzed seven times, and the RSD was
calculated using an external calibration (Table 2).
RT:4.14
AA:91767
SN:15
10.1
10.2
10.3
10.4
10.5
Time (min)
RT: 10.21
AA: 32608
SN: 568
RT: 7.04
AA: 117284
SN: 24
8.00
8.05
8.10
8.15
8.20
8.25
8.30
Time (min)
RT:8.11
AA:3895
SN:38
RT: 11.44
AA: 282645
SN: 65
9
9.0
9.1
9.2
9.3
Time (min)
RT: 9.11
AA: 4468
SN: 35
RT: 6.04
AA: 82901
SN: 12
5.1
5.2
5.3
5
Time (min)
RT: 5.07
AA: 28578
SN: 125
16.42 - 17.10
SM:
7G
RT: 16.69
AA: 205975
6.2
6.3
6.4
6.5
6.6
Time (min)
RT: 6.26
AA: 7123
SN: 254
Naphthalene
PCB153
Phenanthrene
Anthracene
Aldrin
Chrysene
benzo(a)
anthracene
Alpha
endosulfan
Fluorene
Tetrachloro
benzene
Benzoperylene
Trifluralin
Compound
% RSD % RSD % RSD
Building
Material
Soil
Water
PCB180
2.5
6.4
5.3
PCB118
2.8
5.7
4.3
Benzo[a]anthracene
2.7
1.6
6.7
Benzo[a]pyrene
2.5
2.4
7.2
Benzo[b]fluoranthene
2.2
3.2
7.5
BHC-gamma (Lindane, gamma HCH)
2.9
7.3
7.8
Dieldrin
4.2
3.5
6.9
Endosulfan I (alpha isomer)
2.9
7.2
7.2
Endosulfan II (beta isomer)
3.4
7.7
7.3
Repeatability for all compounds in the matrix was below
10% RSD. TraceFinder software performed all
integrations without manual intervention.
Figure 5: Peaks at 2 µg/L level; 2 pg absolute amount injected on column
Table 2: Relative standard deviation of seven injected samples in various matrices


