


 296 / 302

6
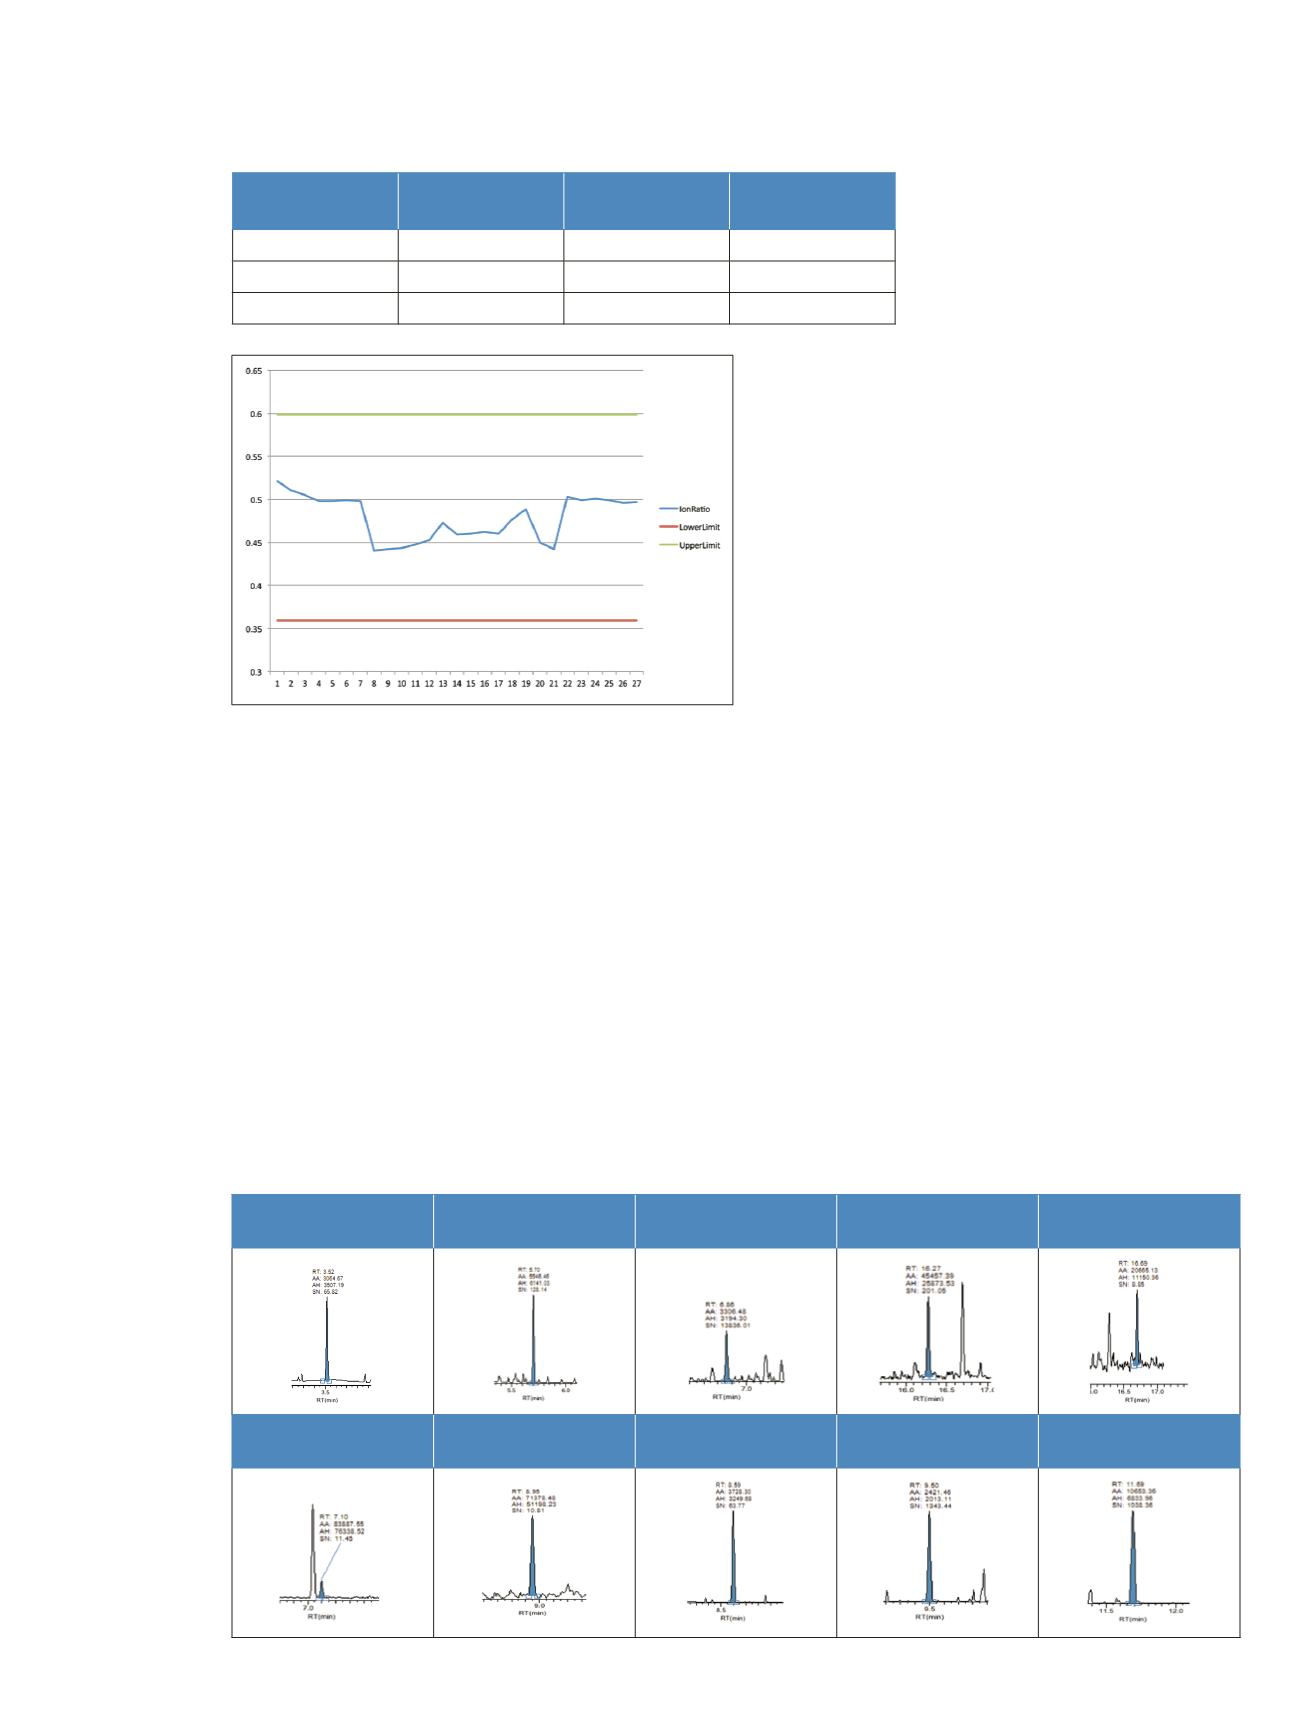
Ion Ratio Stability
All compounds had at least two transitions in the method,
and the two ions had been monitored throughout the
samples, blanks, and standards.
Figure 6: Ion ratio of hexachloroethane, plotted with the
upper and lower allowed limit according to the EU guidelines
for performance of analytical methods.
4
The average and the
standard deviation are shown in the table above.
Throughout the complete series of calibration curves,
water samples, soil samples, and building materials, the
ion ratios were calculated. The ion ratio precision
demonstrated good confirmation in both samples and
standard injections across the concentration range.
Sample Results
A small selection of compound peaks at low levels in
matrix is shown in Figure 7, demonstrating the sensitivity
and selectivity of the measurements.
Below, a selection of matrix and compounds at low levels,
and the concentrations, are given as the absolute amount
on column.
Figure 7: Compound peaks in various sample matrices at low levels
Hexachloroethane
Ratio
Benzoperylene
Ratio
Average
0.479
Average
2.910
Standard deviation
0.025
Standard deviation
0.124
RSD
5.3%
RSD
4.3%
Hexachloroethane in
water at 0.5 pg
Pentachlorobenzene in
water at 1.6 pg
Lindane in soil
at 1 pg
Indenopyrene in soil
at 2 pg
Benzo(ghi) perylene
in soil at 1 pg
Anthracene in soil
at 1.5 pg
o,p DDE in soil
at 2 pg
Heptachlorepoxide in
water at 2 pg
Dieldrin in water
at 2 pg
PCB 180 in water
at 0.86 pg