


 292 / 302

2
Method Setup
A method was developed for the Thermo Scientific
TRACE
™
1310 Gas Chromatograph and the TSQ 8000
Mass Spectrometer (Table 1).
Table 1. Recommended instrument conditions
TRACE 1310 GC
Injection Volume:
1 μL
Liner:
Siltec baffled liner (P/N 453T2120)
Carrier Gas:
He, constant flow, 1.15 mL/min
Column Type:
20 m, 18 mm ID, 0.18 µm df, TG-XLBMS
(P/N 26079-5780)
Column Oven:
Initial 60 ˚C, hold 1 min. Ramp 30.0 ˚C min to
200 ˚C. Ramp 10.0 ˚C min to 320 ˚C.
Hold 2.0 min.
Transfer Line:
320 ˚C
TRACE 1310 GC PTV program
Injector Temperature: 80 ˚C, Splitless Injection 1 min
PTV Inject:
80 ˚C, 0.1 min. 600 ˚C/min to transfer step
PTV Transfer:
320 ˚C, 5 min, 870 ˚C/min to clean step
PTV Clean:
325 ˚C, 15 min, clean flow 25 mL/min
TSQ 8000 Mass Spectrometer in EI mode
Source Temperature: 350 ˚C
Ionization:
EI, 70 eV
Emission Current:
50 μA
Resolution:
Q1 normal
Collision Gas:
Argon
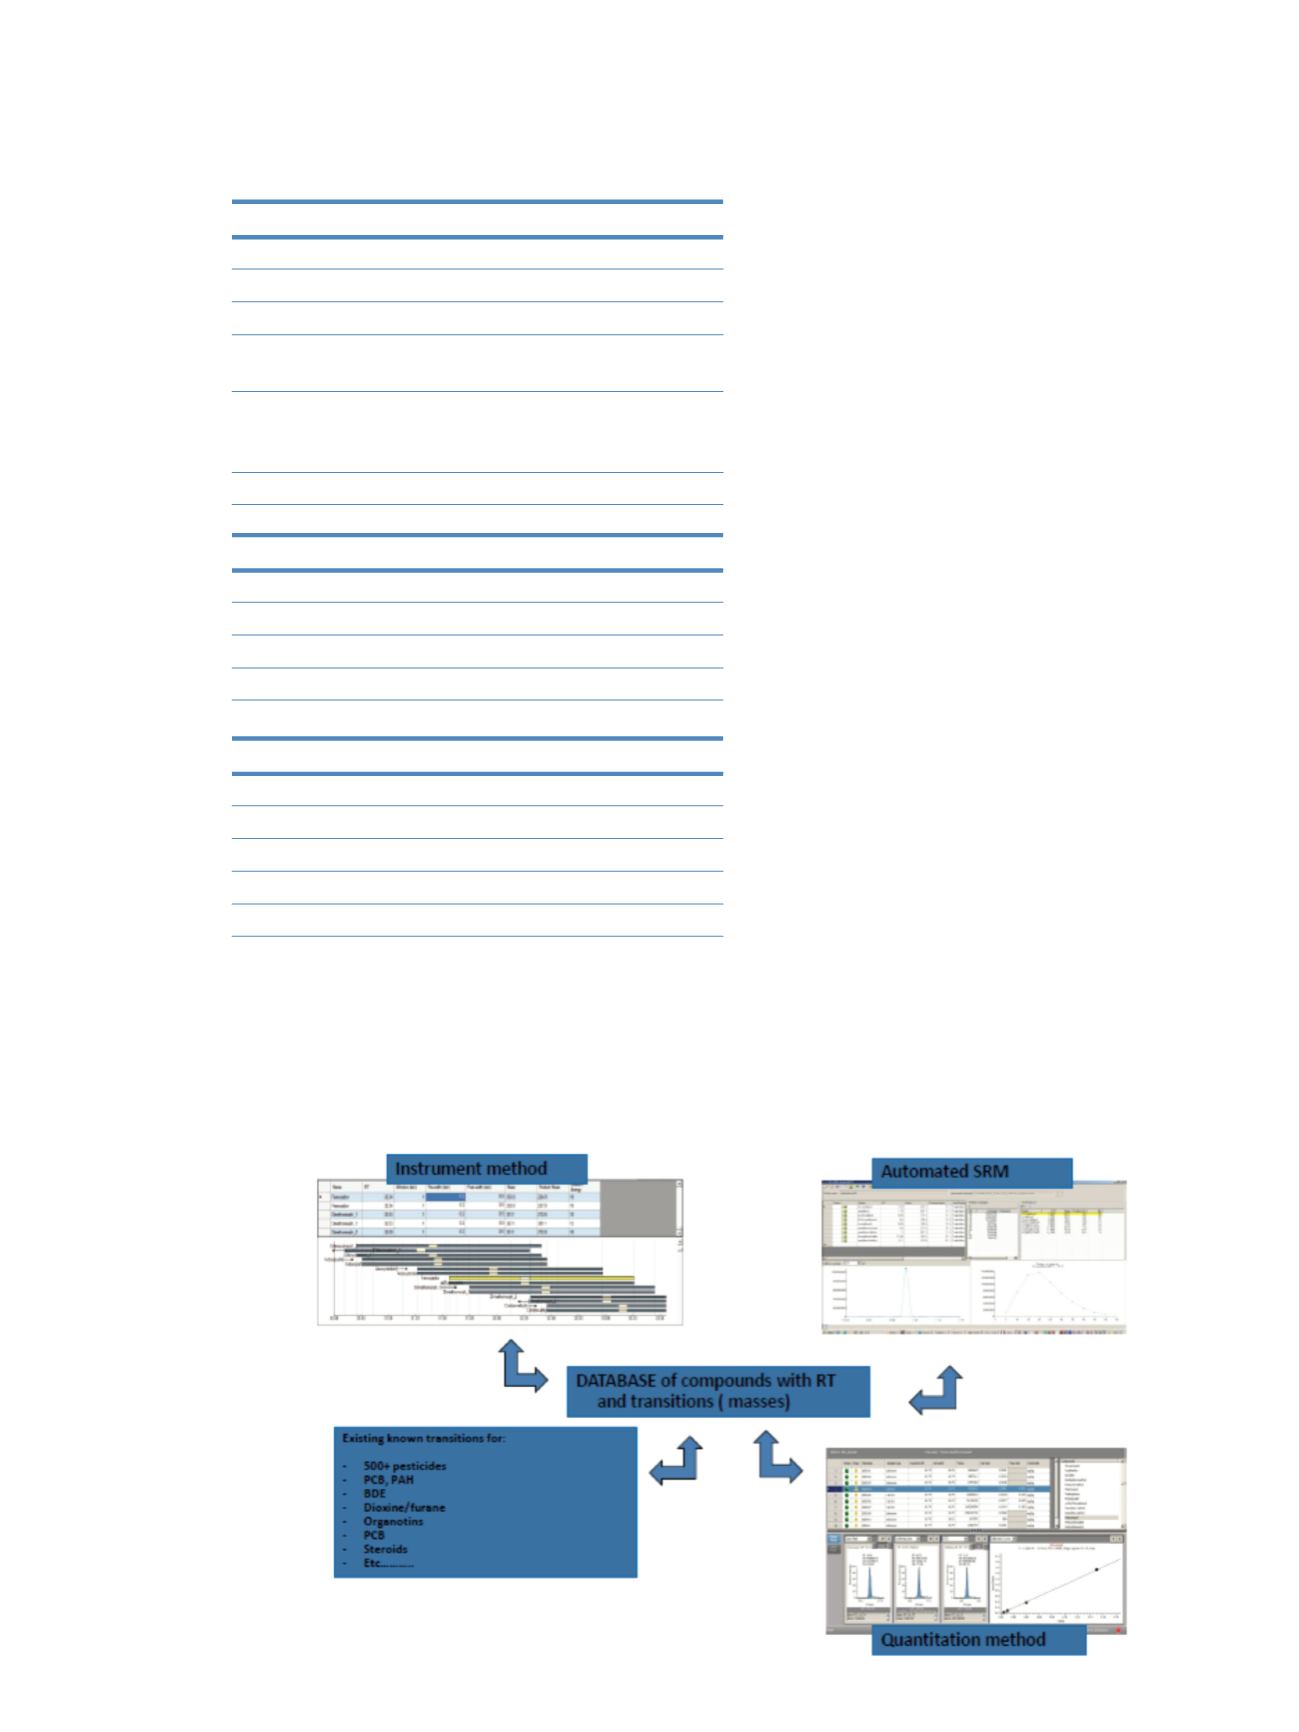
Method Adoption: Mass Spectrometer Acquisition
Method and Quantitation Method
With the TSQ 8000 GC-MS/MS system, the operator can
perform automated SRM method development,
shortening the method development time considerably.
AutoSRM accelerated the method development process.
The optimized parameters were tracked in a clear and
simple way. The program started from a Full Scan
analysis, and the peaks were identified with a library
search. Clicking on each peak revealed a list of most
intense ions, and those were selected to be pushed into a
working list and used for the second injection, the product
ion scan.
The results were again plotted into a chromatogram and,
by clicking on the peaks, the product ions were listed into
a table of decreasing intensity. Finally those product ions
were pushed into a working list, and the final optimization
started where the ions were subjected to increasing
collision energy. This was plotted into a graphical
representation and into a third working list. Selecting this
working list created a SRM method for all compounds,
which was linked to a full instrument method.
Furthermore, the transitions and the retention times were
exported into a compound data base, linking the method
automatically to a quantitative method in Thermo
Scientific TraceFinder
™
software.
A comprehensive explanation is found in application brief
AB52998: Introducing AutoSRM: MRM Simplicity for
High Performance Results.
3
Tuning
A complete automated tuning was provided with the
TSQ 8000 GC-MS, ensuring reproducible tuning, even
when different users were working with the instrument.
The tune contained an automated leak check using the
ratio between the native air/water background and a
metered amount of air introduced into the source.
The tuning was saved to the instrument automatically and
the last tune file was coupled to the instrument method by
default, but it was also perfectly possible to attach another
tune file to the method.
Figure 1. Graphical representation of the links between the various
software parts within the compound database