


 119 / 302

0.3 to 22 ng L
-1
(Table 3). As suggested by
Hernandez
[8]
, the use of two SRM transi-
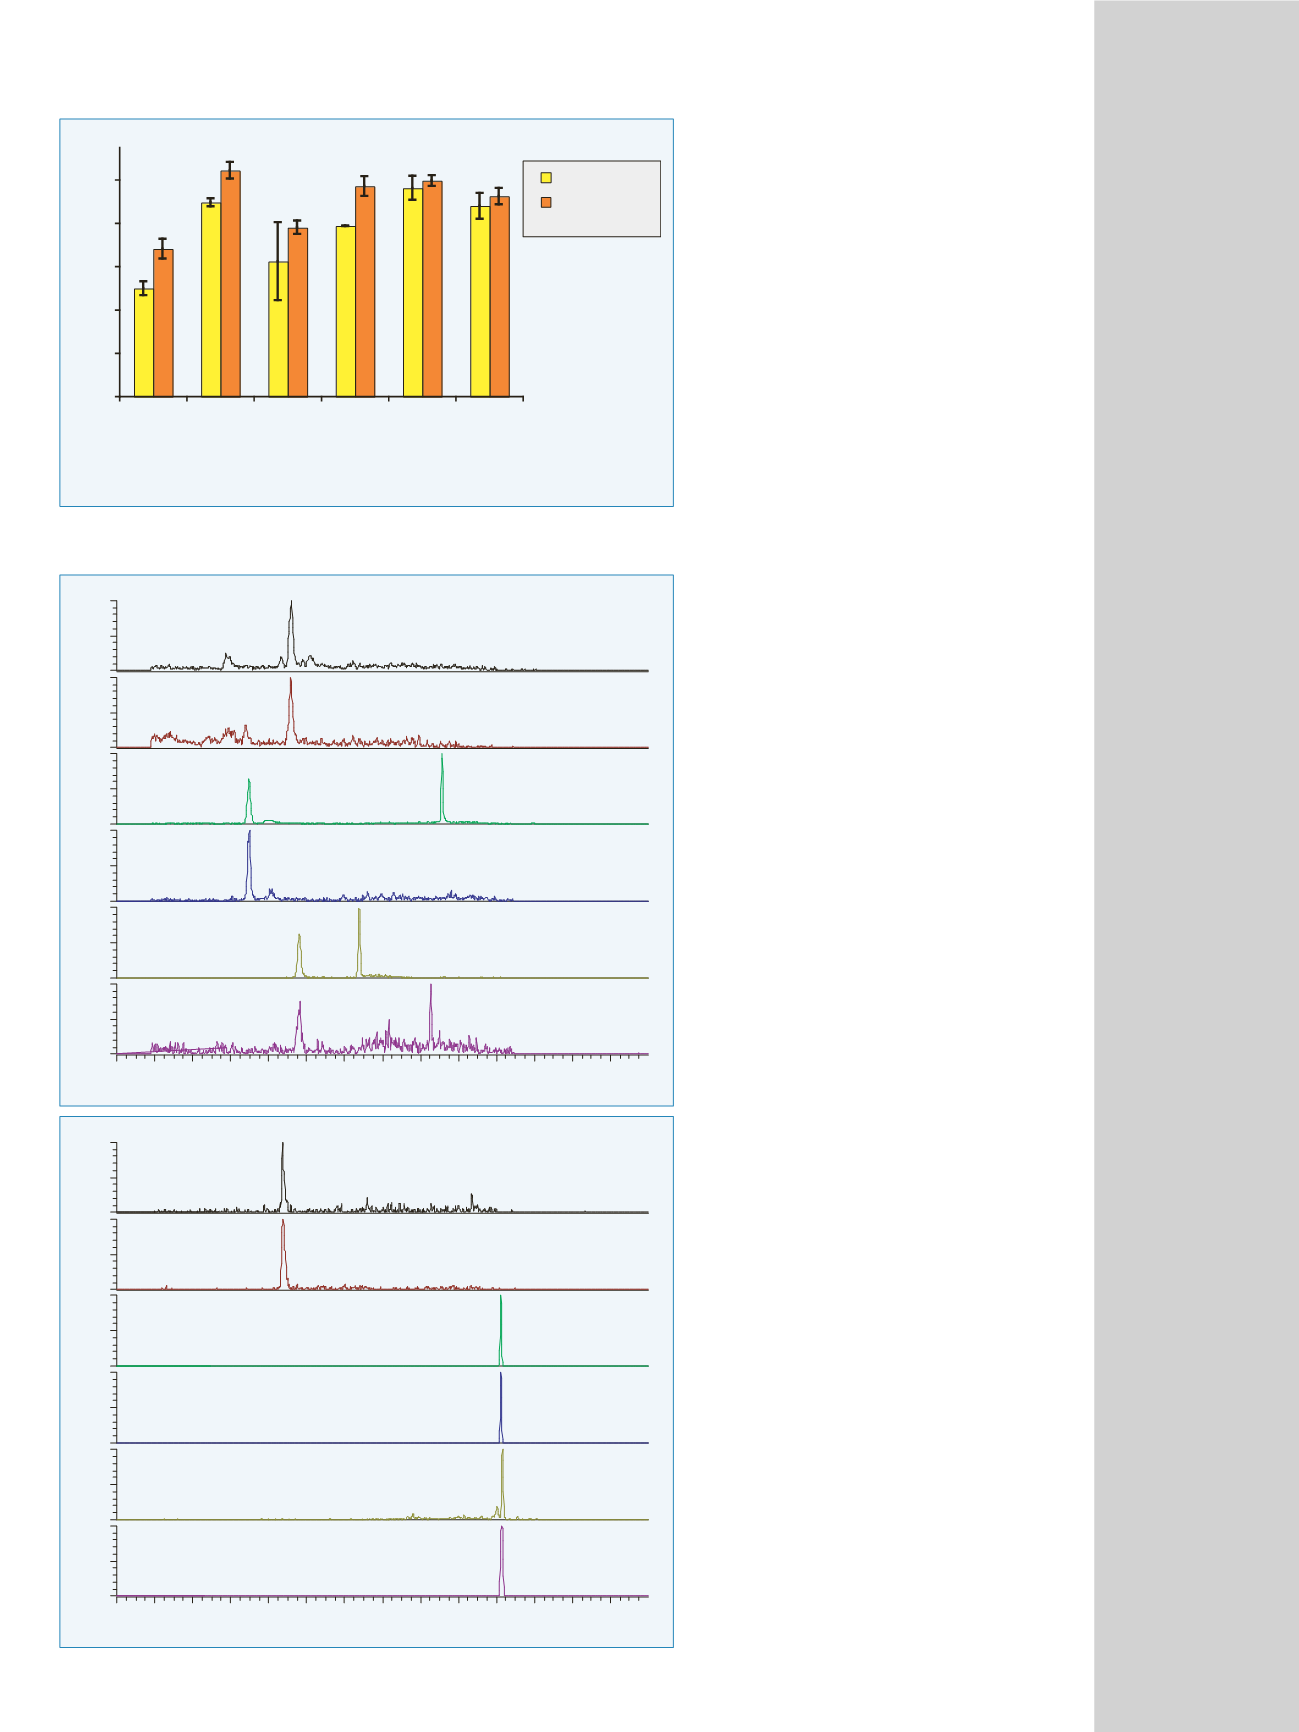
tions in the analytical method (Figure 3)
as well as their peak ratios effectively and
unambiguously confirmed the presence of
the studied anti-infectives in all the samples.
SRM peak ratios were reproducible (RSD
<10%) and differences with SRM peak
ratios of spiked standards were not higher
than 20% except for AZI (64%).
The tandem-SPE approach utilized to
pre-concentrate and extract the analytes
from untreated and treated sewage improved
the recovery on all six analytes (Figure 2).
The combination of reversed-phase and
ion-exchange surface chemistry proved to
be a suitable way to extract compounds
having different chemical properties such
as p
K
a
and p
K
ow
.
All targeted anti-infectives were found
in the wastewater samples in concentrations
ranging from 39±1 to 276±7 ng L
-1
(Figure 4).
Anti-infective daily mass flows in the
St. Lawrence River were estimated using
the flow of the sampling day (35 m
3
s
-1
)
(Table 4). These results show that while
anti-infective concentration in urban waste-
waters are typically in the low nanogram-
per-liter range, their daily discharged inputs
in surface waters can be substantial.
0
20
40
60
80
100
Sulfamethoxazole
Trimethoprim
Ciprofloxacin
Levofloxacin
Clarithromycin
Azithromycin
Recovery/%
Reversed phase
Reversed phase
+ mixed mode
Figure 2: Analytes mean percentage recovery (spiked in the effluent at 500 ng L
-1
,
n
=2)
100
50
100
50
100
50
100
50
100
50
100
50
0
2
4
6
8
10
12
14
16
18
20
22
24
26
Time (min)
Figures 3a-b: Chromatograms showing
two SRM transitions of the studied
compounds in treated wastewater.
Peaks due to interferences are marked
by asterisks(*).
100
50
100
50
100
50
100
50
100
50
100
50
0
2
4
6
8
10
12
14
16
18
20
22
24
26
Time (min)
Sulfamethoxazole
254.08
→
92.11
Sulfamethoxazole
254.08
→
108.10
Trimethoprim
291.16
→
123.70
Trimethoprim
291.16
→
230.17
Ciprofloxacin
332.76
→
288.15
Ciprofloxacin
332.16
→
231.07
Levofloxacin
362.17
→
261.12
Levofloxacin
362.17
→
221.05
Clarithromycin
748.55
→
590.36
Clarithromycin
748.55
→
115.99
Azithromycin
375.33
→
82.96
Azithromycin
749.54
→
158.04
a
b
9.21
6.96
9.16
6.99
9.61
9.67
8.77
8.75
20.23
20.23
20.31
20.30
*
*
*