


 124 / 302

4
Optimizing a Generic Approach to Analyzing PPCPs in River Water Kelly
ontaminants
arch area which
tal effects of
to be fully
ht on the
vironment.
al approach is
rs. A consequence
of the true breadth
g residues within
n-targeted
traditional
nted herein for
rescribed and
ed mode solid
raphy-high
e potential to
lso presented.
in Figure 1, was
y diverse species
classes, functional
rted environmental
d semi-
Results & Discussion
1. SPE Method Development
The recoveries of compounds were evaluated for two
different SPE sorbents using different sample volumes.
Figure 2 shows that optimized absolute recoveries for the
majority of compounds were obtained using the Retain
PEP-functionalized polystyrene-divinylbenzene sorbent with
a 100 mL sample when adjusted to pH 2.
2
. ‘Semi
-
Targeted’ Screening of Real Samples
The developed analytical method was applied to the
analysis of both Thames river water and influent
wastewater. The presence of an analyte was confirmed by
comparison with a reference standard. As and example the
presence of cocaine is shown in Figure 3.
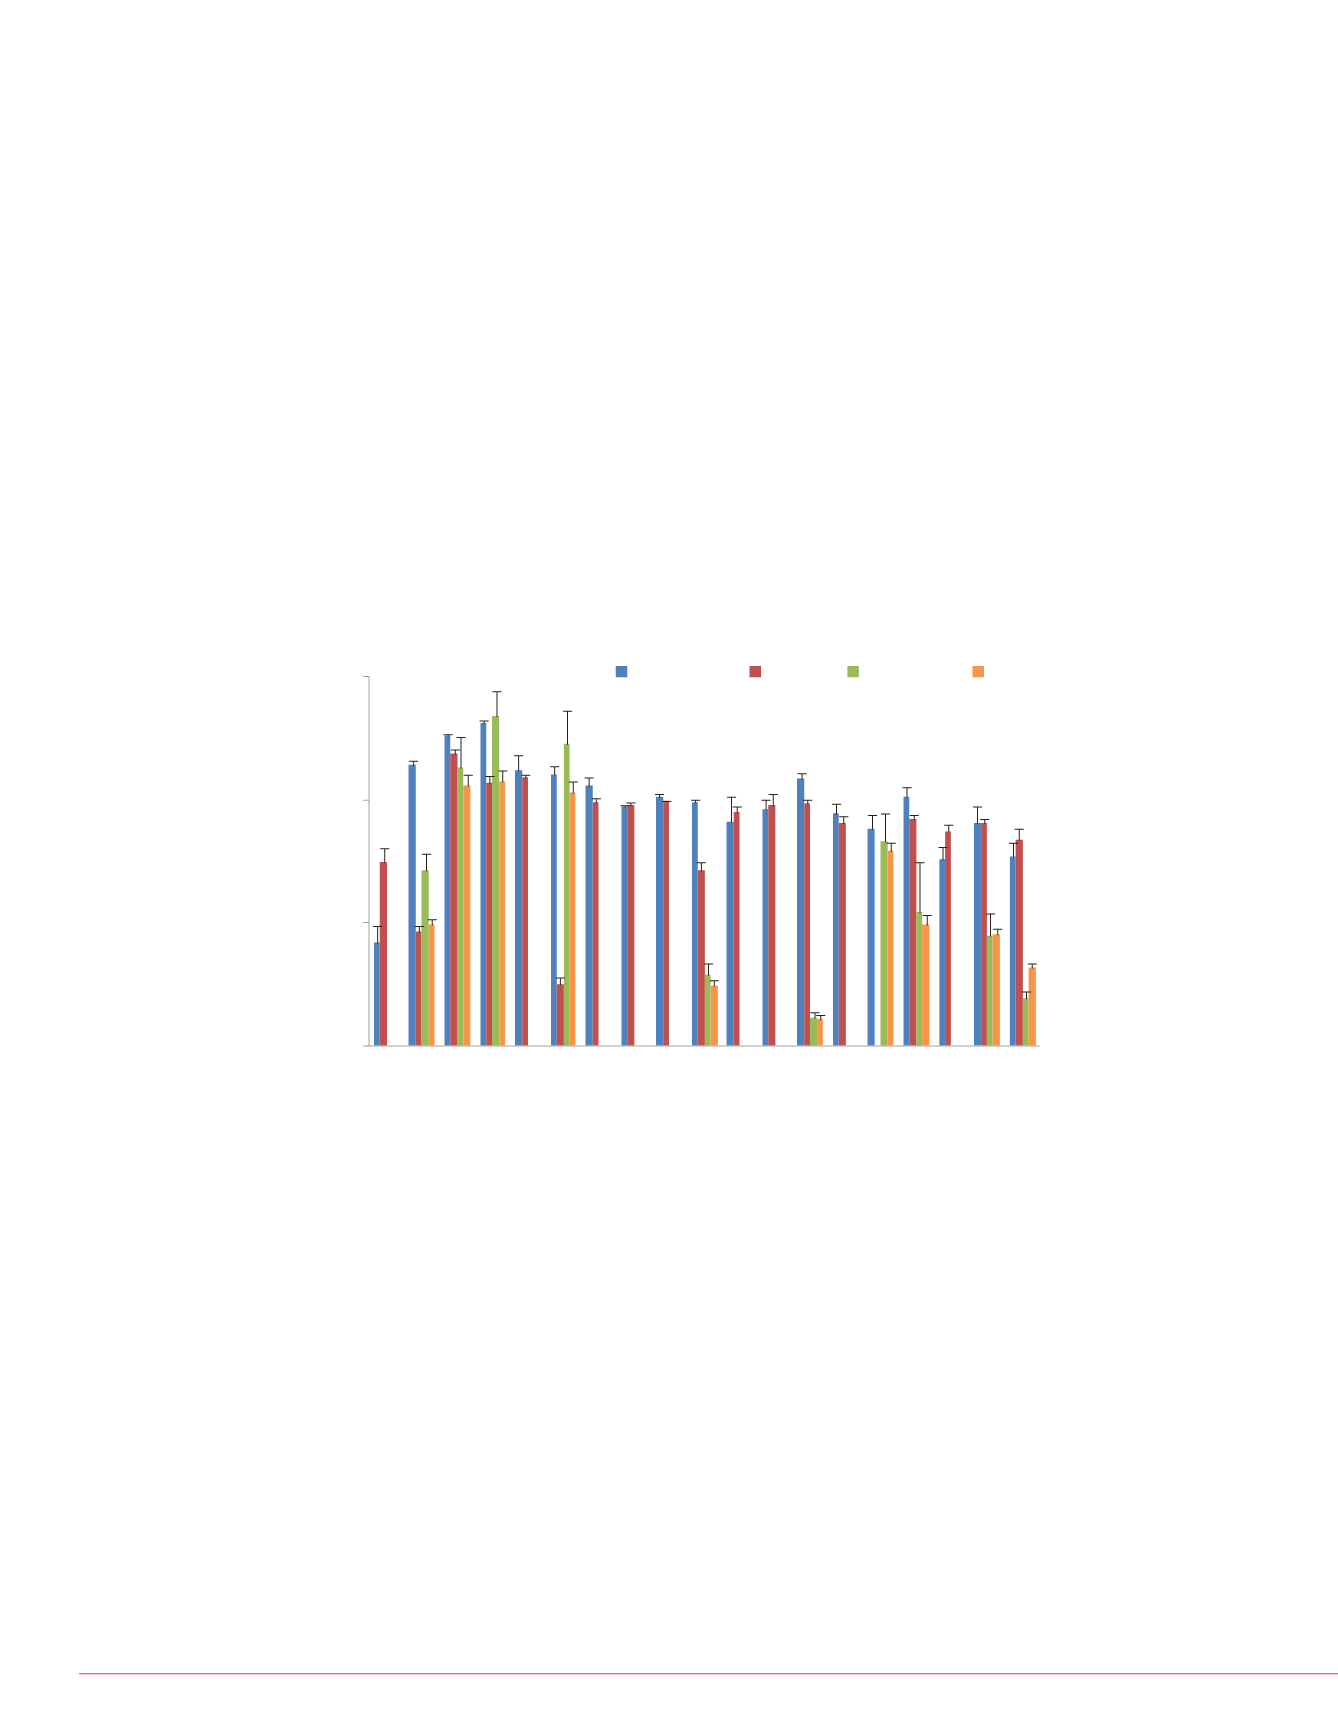
FIGURE 2. Absolute recoveries obtained using a PS-
DVB sorbent (PEP) and a mixed mode cation exchange
sorbent (CX) with a sample adjusted to pH 2.
0
50
100
150
Salicylic Acid
Caffeine
SMX
SMZ
Clofibric Acid
T rimethoprim
Ketoprofen
Bezafibrate
Warfarin
Cocaine
Diclofenac
Ibuprofen
Carbamazepine
Propranolol
Ketamine
T emazepam
Nortriptyline
Diazepam
Amitriptyline
%AbsoluteRecovery
Compound
100mL PEP 1L PEP 100mL CX 1L CX
FIGURE 3. Cocaine confirmation. t
R
: retention time;
AA: Peak Area; AH: Peak Height; BP: Base Peak
accurate mass.
t
R
: 8.96
Levels of the m
across the wee
observed in riv
diazepam. It ca
approximately t
compounds.
3. Mephedro
Using the abov
the illicit drug,
both river and
FIGURE 5. W
in influent wa
1E+04
1E+05
1E+06
1E+07
1E+08
Wed T h
Peak Intensity
FIGURE 6. Ch
the illicit drug
influent waste
100
0
50
100
% Relative Abundance
0
50
100
tR:
AA: 5
AH: 3
BP: 1
t
R : 6
AA: 1
AH: 1
BP: 1
t
t
R : 6.77
AA: 247214
AH: 10447