


 126 / 302

6
Optimizing a Generic Approach to Analyzing PPCPs in River Water Kelly
10mM Ammonium
Acetonitrile
10 mM Ammonium
Acetonitrile
μ
L
L/min
50
00
-ve. 3 kV
-ve. 52.5 V
-ve. 135 V
FWHM
0-1000
0,000
ms
(20eV)
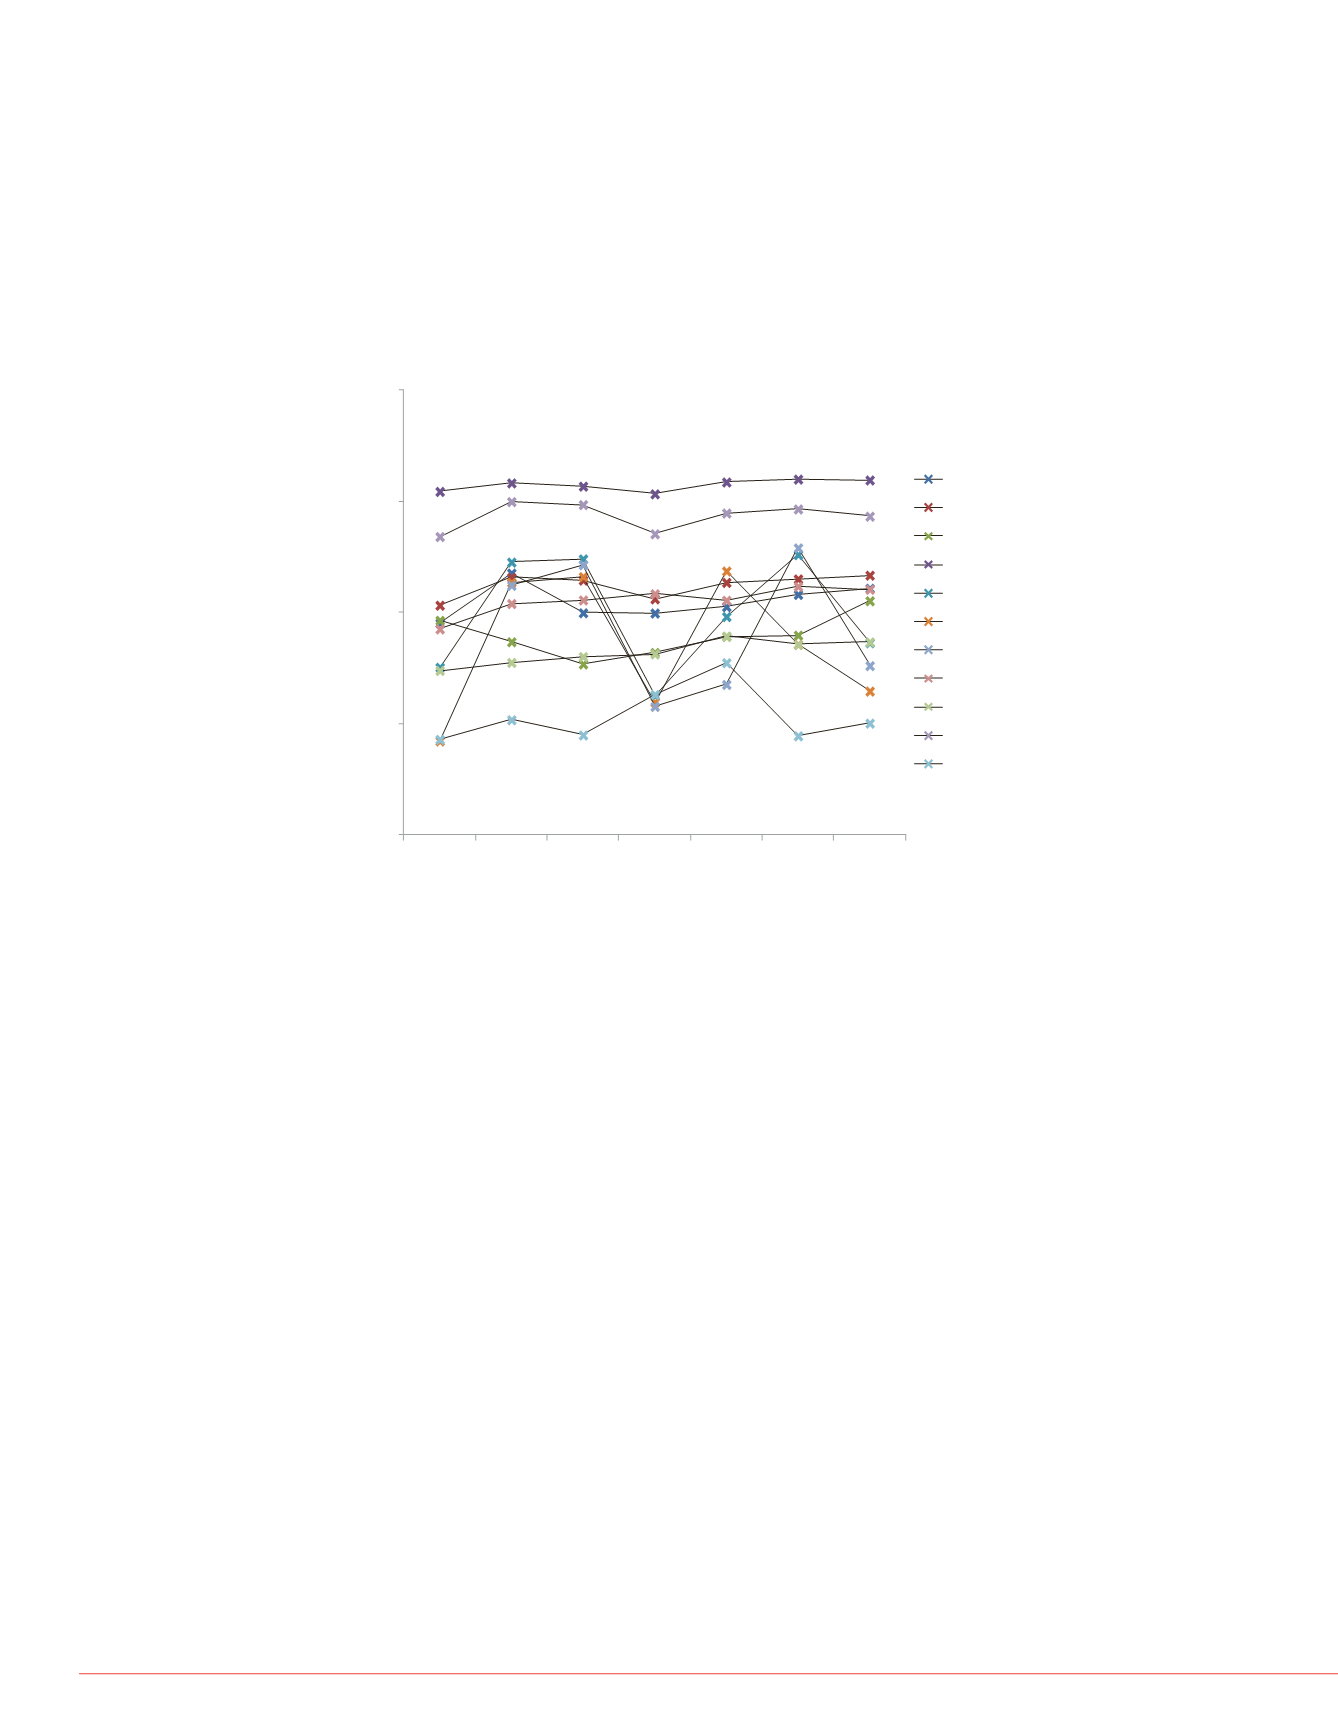
Week-long qualitative studies of both river water and
influent showed that the majority of the targeted
compounds were present. This is shown in Figures 4 and 5
respectively. A quantitative analysis is now in preparation.
Time (min)
FIGURE 4. Weekly variation of identified compounds in
Thames river water
.
1E+03
1E+04
1E+05
1E+06
1E+07
Wed Thurs
Fri
Sat
Sun
Mon
T ues
Peak Intensity
Amitriptyline
Bezafibrate
Caffeine
Carbamazepine
Cocaine
Diazepam
Nortriptyline
Propranolol
T emazepam
T rimethoprim
Warfarin
optimization of
Ongoing efforts
analysis of bot
is determined
Conclusi
A developed ‘s
confirm the pre
in both river wa
non-target retr
the detection of
environmental
© 2014 Thermo Fisher Scientific I
All trademarks are the property of
This information is not intended to
of others.
PO 21027-EN 0814S