


 125 / 302

5
Thermo Scientific Poster Note
•
PN21027 ISC 0814S
ed semi-
Scientific™
remen,
MS conditions
c™
2.6
m,
s 10mM Ammonium
Acetonitrile
10 mM Ammonium
Acetonitrile
0
μ
L
μ
L/min
50
00
-ve. 3 kV
-ve. 52.5 V
-ve. 135 V
2
. ‘Semi
-
Targeted’ Screening of Real Samples
The developed analytical method was applied to the
analysis of both Thames river water and influent
wastewater. The presence of an analyte was confirmed by
comparison with a reference standard. As and example the
presence of cocaine is shown in Figure 3.
Week-long qualitative studies of both river water and
influent showed that the majority of the targeted
compounds were present. This is shown in Figures 4 and 5
respectively. A quantitative analysis is now in preparation.
S
C
T
Ca
N
A
FIGURE 3. Cocaine confirmation. t
R
: retention time;
AA: Peak Area; AH: Peak Height; BP: Base Peak
accurate mass.
0
5
10
15
20
25
30
35
Time (min)
0
50
100
0
50
100
0
50
100
% Relative Abundance
0
50
100
t
R
: 8.96
AA: 17705002
AH: 1643716
BP: 304.1536
t
R
: 8.95
AA: 10123685
AH: 977636
BP: 182.1172
t
R
: 9.09
AA: 3439759
AH: 330415
BP: 304.1542
t
R
: 9.08
AA: 2003332
AH: 198966
BP: 182.1174
m/z 304.1543
100 µg/L Standard
m/z 182.1171
Fragment in Standard
m/z 304.1543
River Water Sample
m/z 182.1171
Fragment Confirmation
in River Water Sample
N
O
O
O
O
Mass Extraction Window : 3ppm
FIGURE 4. Weekly variation of identified compounds in
Thames river water
.
1E+06
1E+07
Amitriptyline
Bezafibrate
Figure 6 show
along with an
accurate mas
sample with a
the mephedro
unknown peak
mephedrone
detected in infl
(m/z 160.1117
was present a
river water. Th
optimization of
Ongoing effort
analysis of bot
is determined
Conclusi
A developed ‘
confirm the pr
in both river w
non-target retr
the detection
environmental
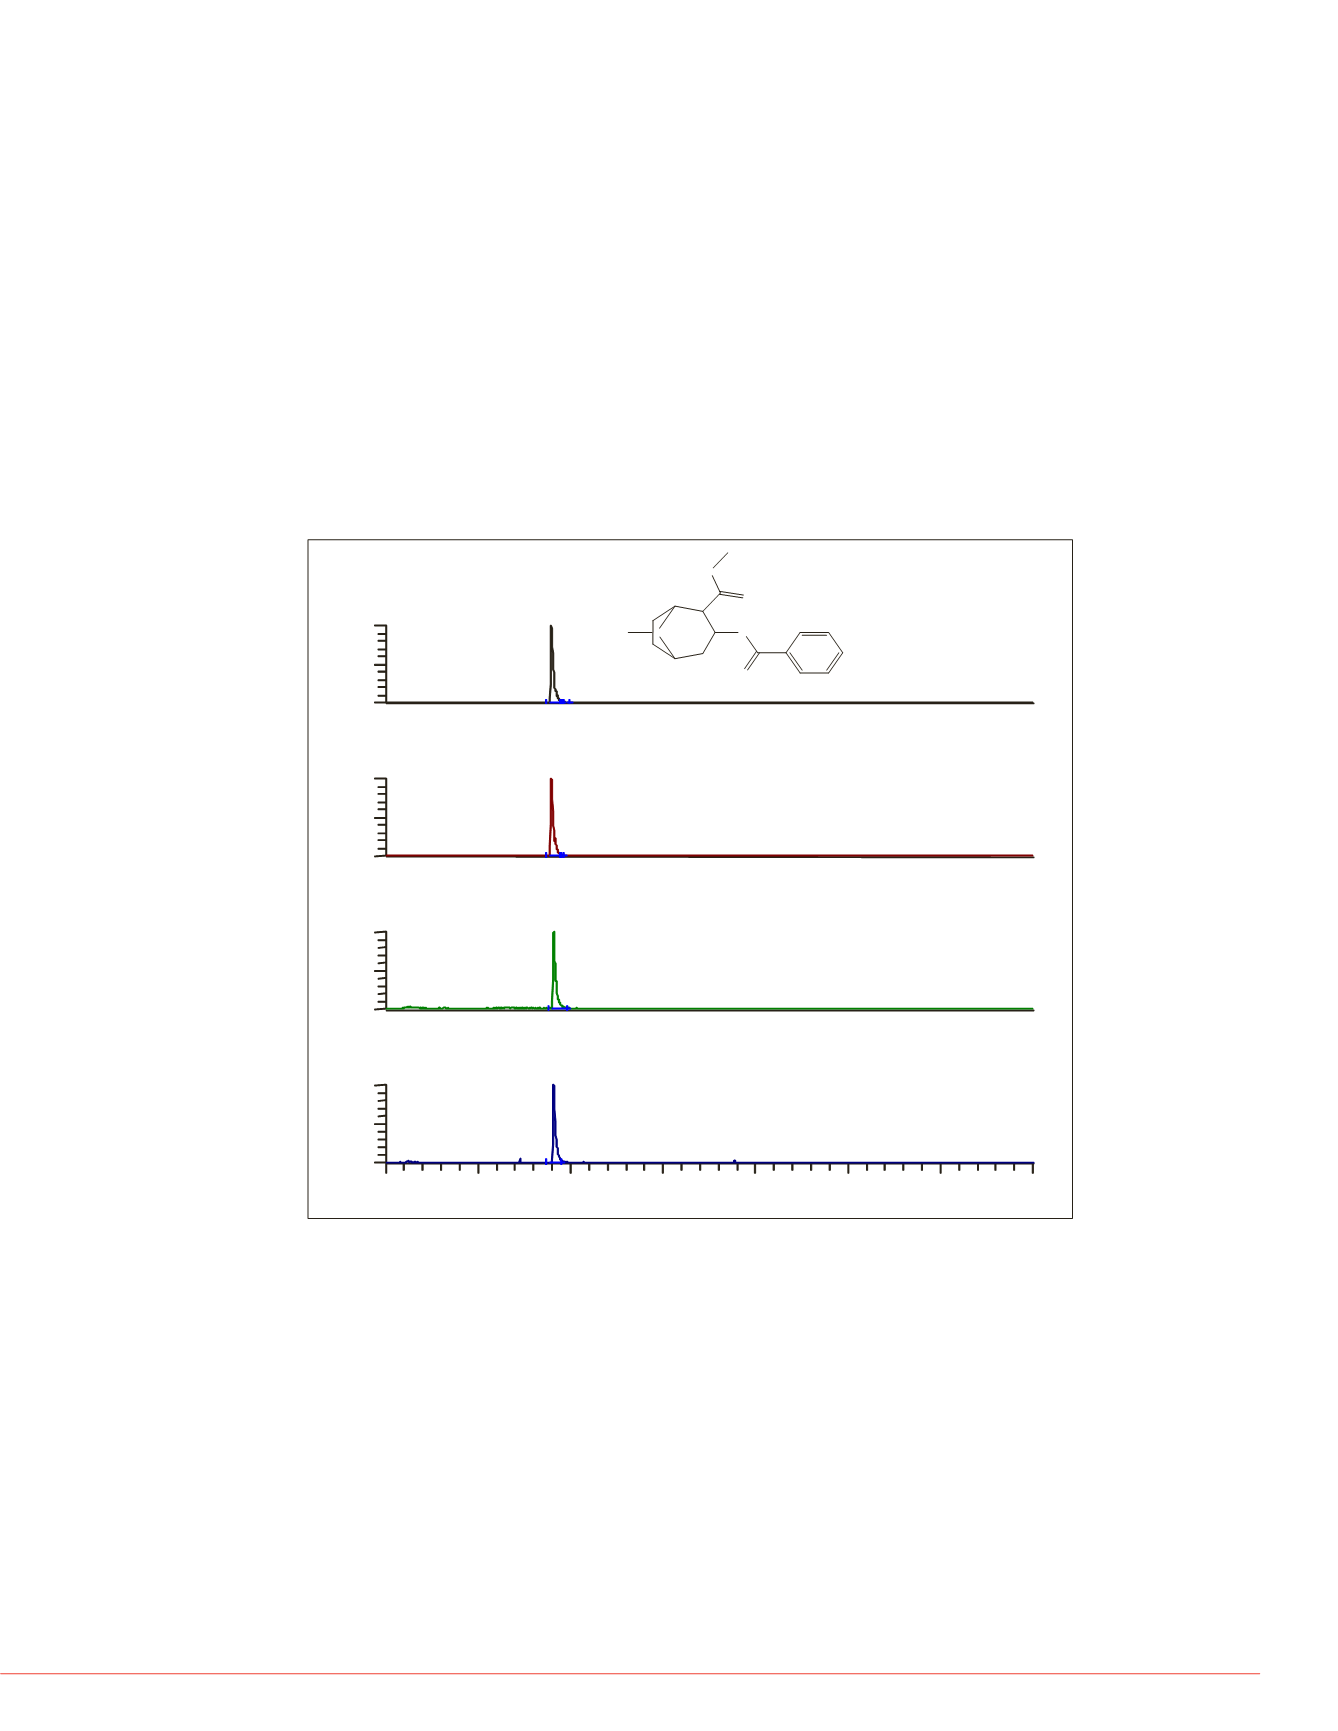
FIGURE 6. C
the illicit dru
influent wast
0
5
0
50
100
0
50
100
0
50
100
% Relative Abundance
0
50
100
t
AA:
AH:
BP:
t
R :
AA:
AH:
BP:
t
R : 6.77
AA: 247214
AH: 10447
BP: 178.1225
t
R : 6.99
AA: 1166635
AH: 108908
BP: 178.1226
erimental