


 113 / 302

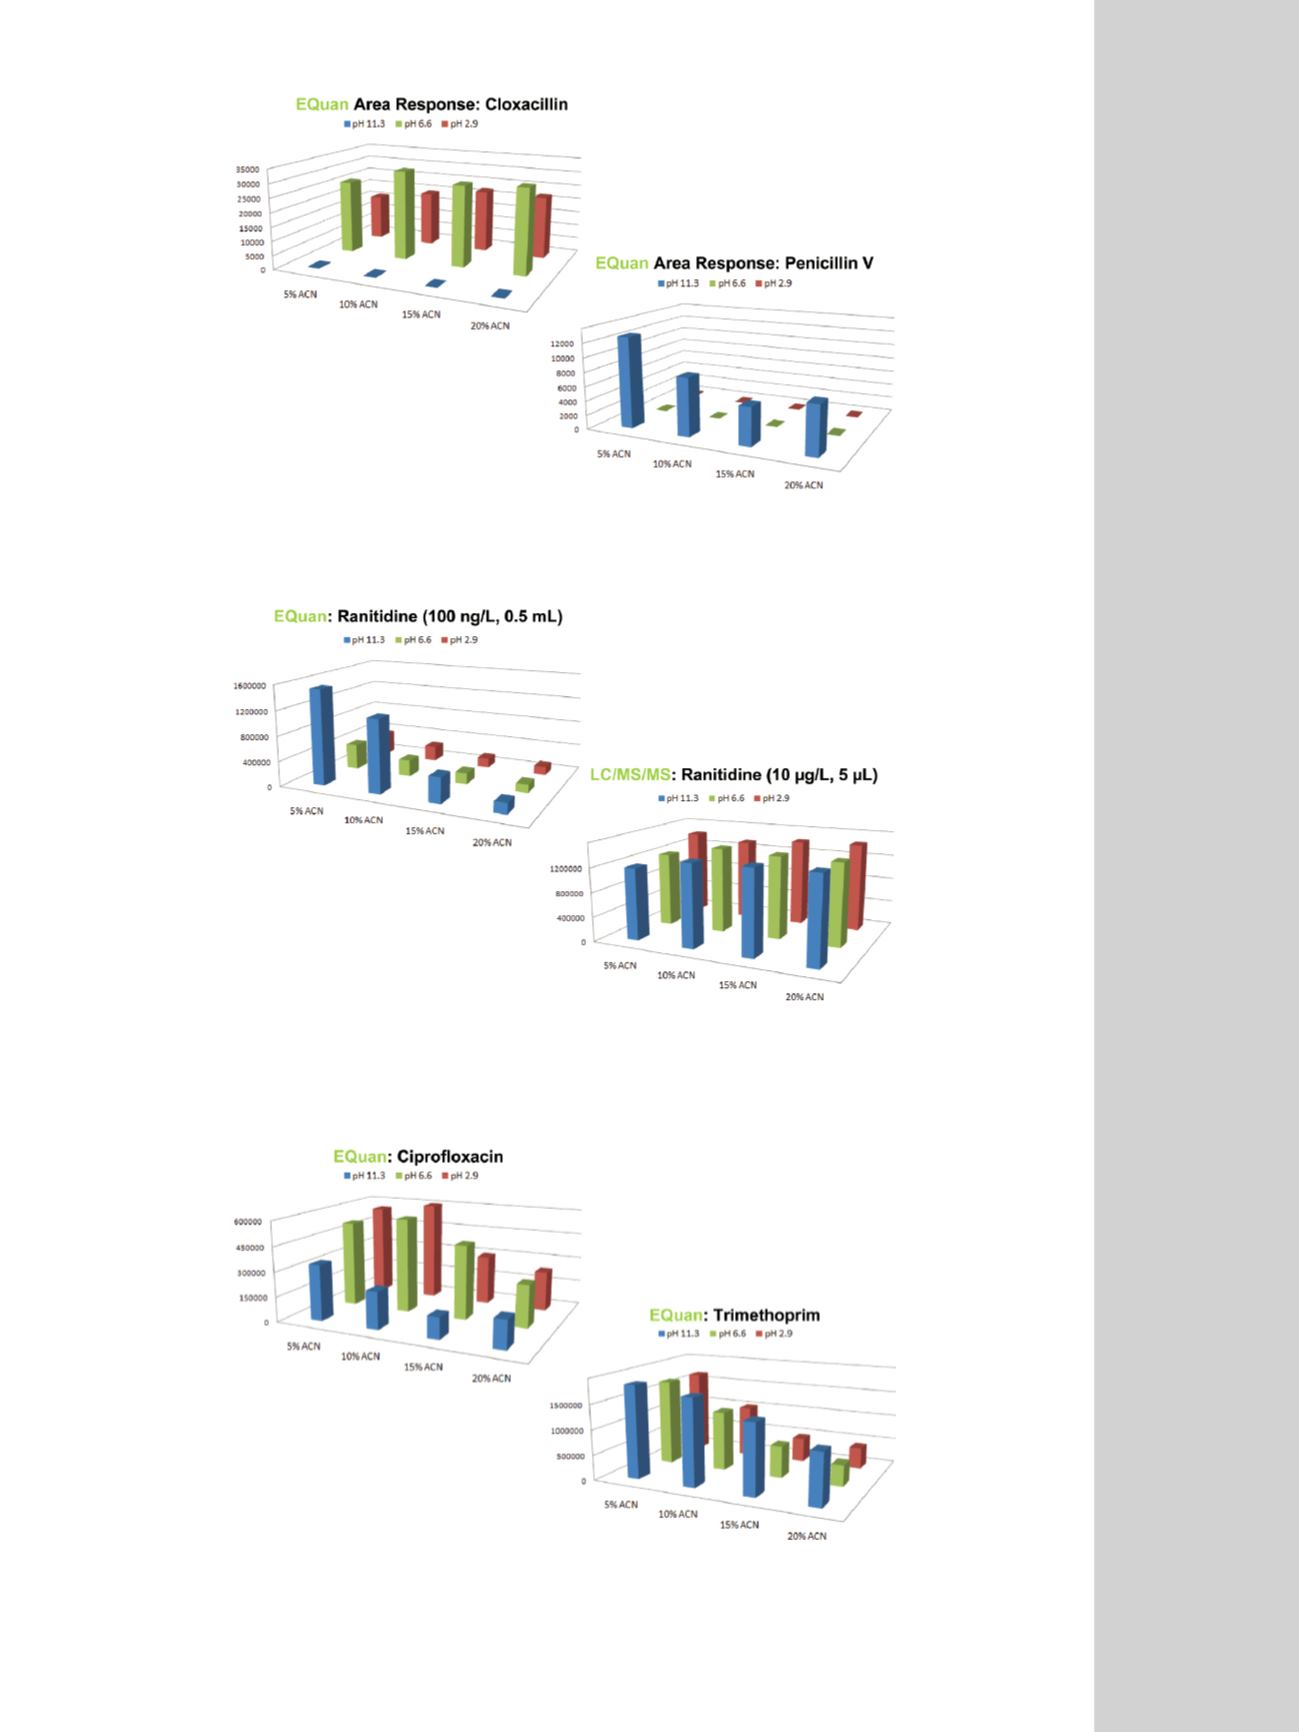
Figure 3. Area response plots demonstrating the pH effect on the sample solubility.
Figure 4. Area response plots for ranitidine demonstrating the pH effect on the preconcentration column.
Figure 5. Area response plots showing effect of decreased retention with increasing %ACN.