


 111 / 302

5.5
6.0
6.5
Time (min)
0
10
20
30
40
50
60
70
80
90
100
0
10
20
30
40
50
60
70
80
90
100
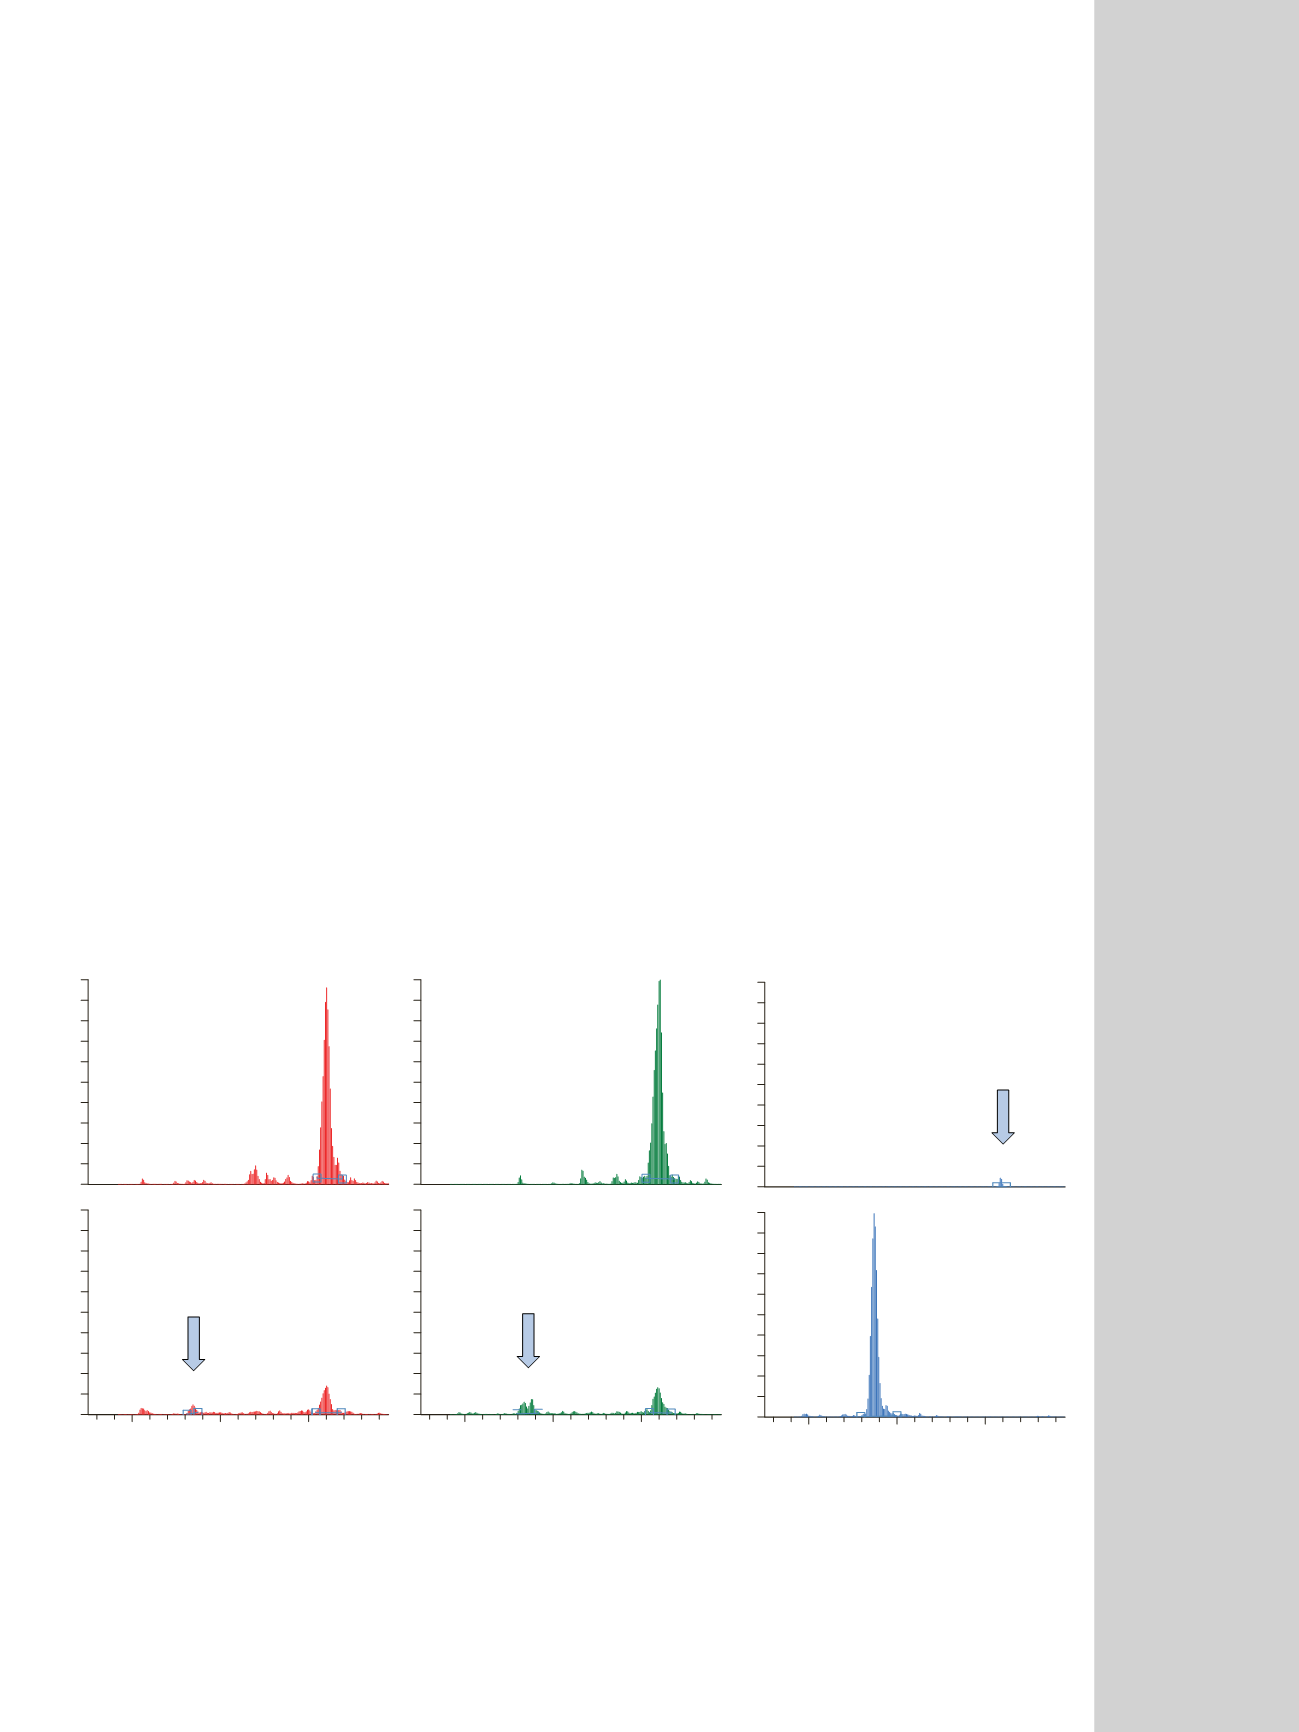
RT: 6.60
AA: 13222
RT: 6.60
AA: 10873
RT: 5.84
AA: 2130
5.5
6.0
6.5
Time (min)
RT: 6.61
AA: 15386
RT: 6.59
AA: 10320
RT: 5.88
AA: 6596
5.5
6.0
6.5
Time (min)
RT: 6.59
AA: 227
RT: 5.87
AA: 64258
4-epi-CTC
CTC
pH 2.9
pH 11.3
pH 6.6
Figure 2. Chromatograms showing the pH effect on chlorotetracycline (CTC).
With such a diverse range of chemical classes, the chal-
lenge was in developing a single LC-MS/MS method with-
out compromising the target ng/L sensitivity. Both sample
pH and the % ACN in the sample affected the response of
PPCPs in water when employing the online sample prepa-
ration approach with the EQuan system. To determine
the best method for achieving ng/L sensitivity on the TSQ
Vantage™ mass spectrometer, the effects of sample pH and
%ACN were investigated.
Effects of Sample pH
Sample pH was found to affect the response of some
PPCPs in water based on chemical reactivity. During the
method development, PPCPs were added to aqueous
solutions at three different pHs: 2.9, 6.6, and 11.3. As
shown in the chromatograms in Figure 2, chlorotetracy-
cline (CTC) was readily observed at pH 2.9 and pH 6.6.
However, at pH 11.3, CTC completely disappeared, being
converted to 4-epi-CTC. It is important to note that no
4-epi-CTC was added to the water samples prior to
LC-MS/MS analysis. All of the 4-epi-CTC detected was
due to the conversion of CTC, which has been shown to
have a short half-life in solutions at pH 11.2. A similar
effect was observed with erythromycin, which reacted
quickly in acidic solution and converted to
anhydroerythromycin at pH 2.9.
The pH also affected the solubility of some PPCPs,
even within the same compound class. Figure 3 displays
the area response for cloxacillin and penicillin. For cloxa-
cillin, the area response at pH 2.9 and pH 6.6 is evident in
the bar chart at the top left; whereas at pH 11.3, cloxacil-
lin was not observed. A similar effect was seen for ampicil-
lin, oxacillin, cefotaxime, and diltiazem. However, the
opposite effect was observed for penicillin V (and G), as
seen in the bar chart in the bottom right. The same trends
were observed with LC-MS/MS (5 µL injection) as with the
EQuan method (0.5 mL injection), indicating that this is a
sample solubility effect.
The pH effect on the MS response was also observed
with several other PPCPs when using the EQuan system.
Using ranitidine as an example, the MS response was
much greater at pH 11.3 than at pH 2.9 or 6.6, as shown
in the chart at the top left of Figure 4. However, this pH
effect was not observed when using a 5 µL injection of the
water samples directly onto the analytical column at the
same mass loading of ranitidine, as seen in the bar chart
in the lower right of Figure 4. This difference in response
is believed to be attributed to the change in the local
partitioning chemistry between ranitidine and the station-
ary phase of the pre-concentration column. With a 5 µL
injection directly onto the analytical column, the partition-
ing chemistry was not affected for a long enough period
to change the retention of ranitidine. Nevertheless, under
the right sample solution conditions, namely pH 11.3 and
5%-10% ACN, ranitidine and other basic PPCPs, such as
cimetidine, codeine, and lincomycin, yielded quantitative
trapping recovery using the EQuan system.