


 107 / 302

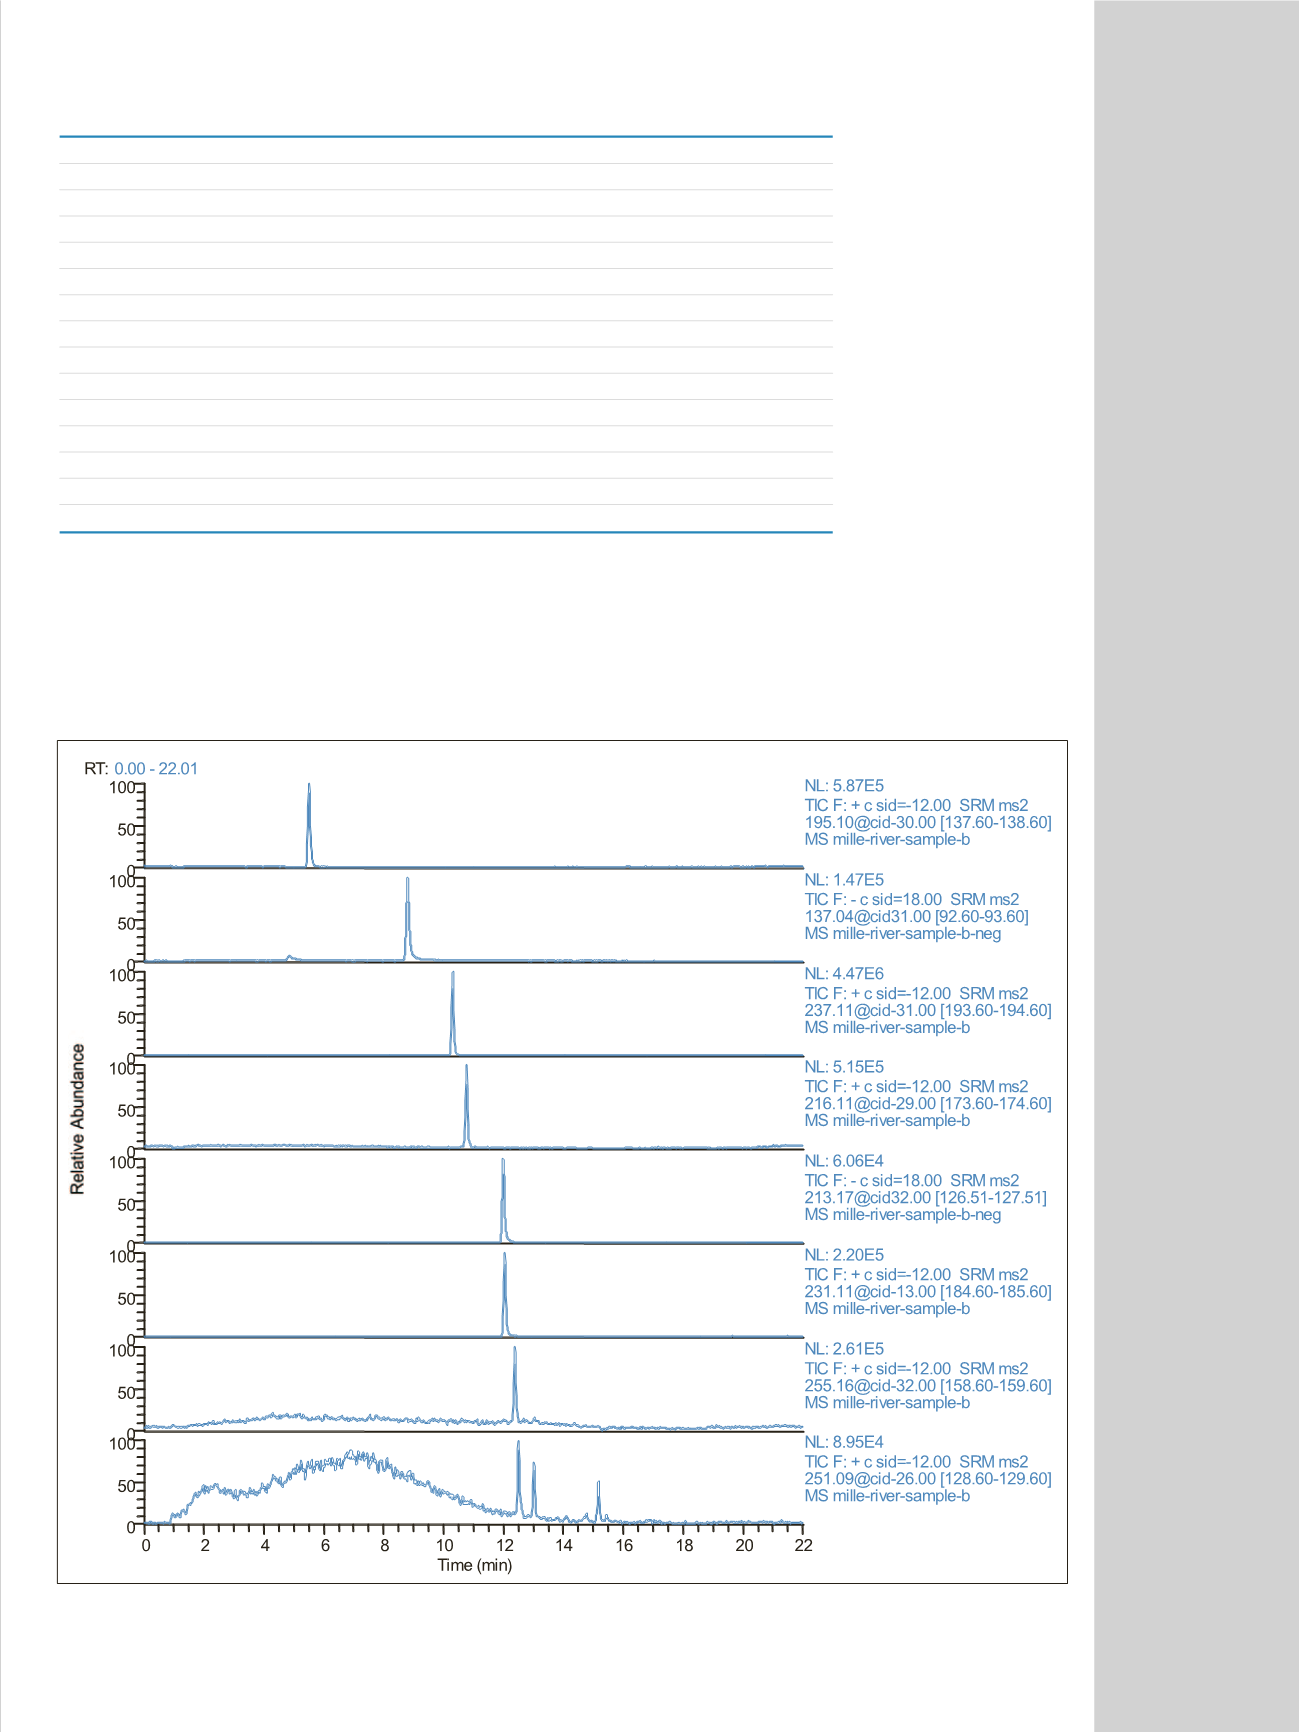
Table 3: Retention time, limit of detection (LOD), linearity, recoveries and RSD (%) data for each detected compounds in tap water.
Compound
Retention time (min)
LOD* (ng/L)
R
2
**
Recovery***(%)
RSD (%)
Trimethoprim
5.46
0.50
0.9998
91
7
Caffeine
5.79
0.07
0.9995
87
9
Estriol
10.14
0.30
0.9981
84
9
Carbamazepine
10.76
0.09
0.9999
86
5
Atrazine
11.41
0.03
0.9995
86
3
Naproxen
12.62
2.00
0.9996
85
9
17-
α
-
Ethinylestradiol
12.85
0.50
0.9931
73
10
Estradiol
12.88
0.10
0.9979
72
6
Estrone
12.94
0.60
0.9989
79
9
Progesterone
14.44
0.08
0.9994
94
4
TCC
15.10
0.20
0.9970
81
10
Gemfibrozil
15.17
2.00
0.9991
84
6
Salicylic acid
8.82
0.90
0.9993
77
6
Clofibric acid
12.00
0.60
0.9989
83
11
*LOD in surface water (Mille Iles River)
**Value for calibration line in river water (0-100 ng/L)
***Recoveries over the total method (surface samples spiked at 50 ng/L, n = 6).
Figure 4: Representative SRM chromatograms of some selected compounds detected in water matrix (Mille Iles River). Peak due to interferences are marked
by asterisks (*)
Caffeine
195.10
→
138.10
Salicylic acid
137.04
→
91.10
Carbamazepine
237.11
→
194.10
Atrazine
216.11
→
174.10
Clofibric acid
213.17
→
127.10
Naproxen
231.11
→
185.10
Estradiol
255.16
→
159.10
Gemfibrozil
251.09
→
129.10
* *