


 106 / 302

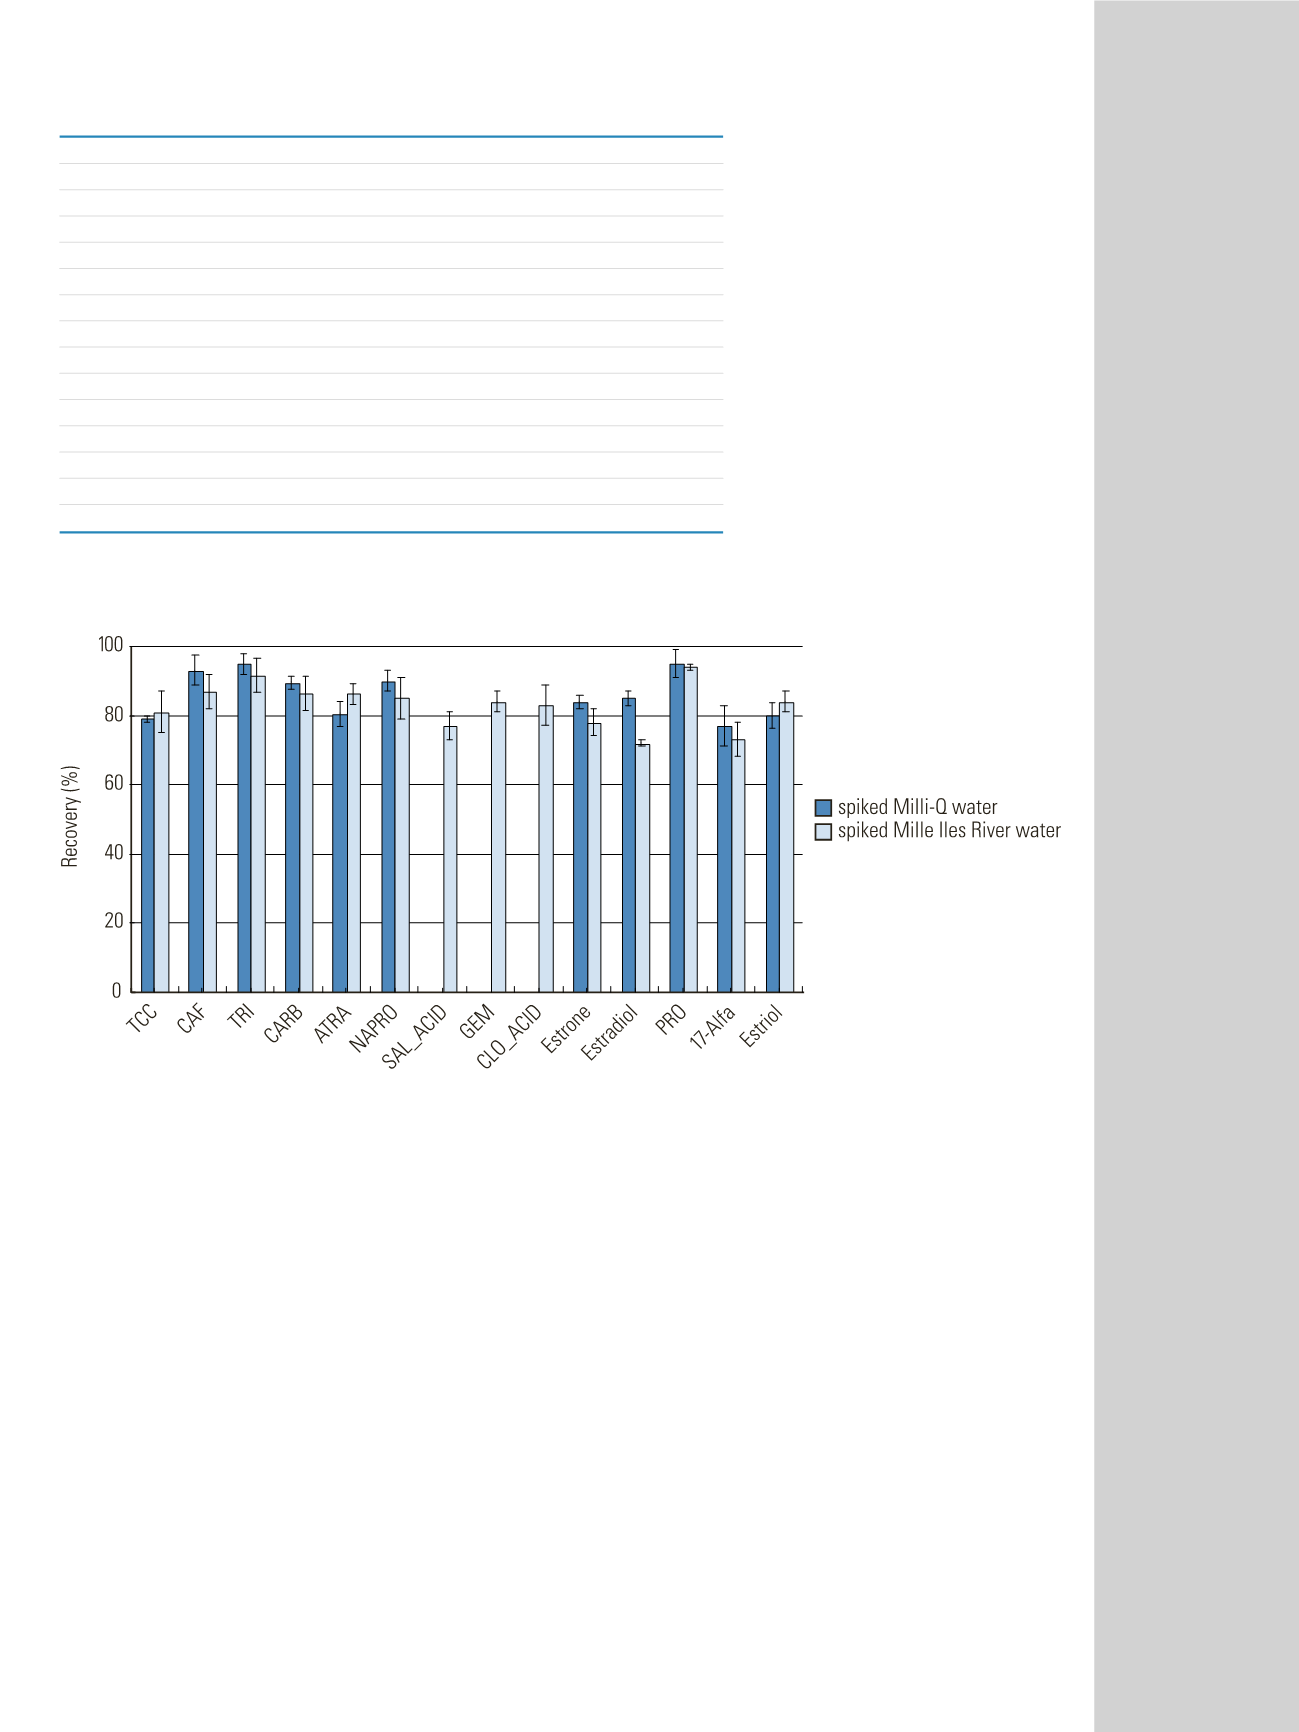
Table 2: SRM transitions used for detection and quantification
Compound
Precursor ion (m/z)
Product ion (m/z)
CE (eV) Tube lens (V)
Trimethoprim
291.16
230.16
22
90
Caffeine
195.10
138.10
18
77
Estriol
271.24
157.10
18
80
Carbamazepine
237.11
194.10
20
80
Atrazine
216.11
174.10
34
97
Naproxen
231.11
185.10
13
101
17-
α
-
Ethinylestradiol
279.16
133.10
31
86
Estradiol
255.16
159.10
17
79
Estrone
271.24
157.10
18
80
Progesterone
315.26
109.10
38
118
TCC
316.99
127.04
32
99
Gemfibrozil
251.09
129.10
20
118
Salicylic acid*
137.04
93.10
31
72
Clofibric acid*
213.17
127.10
32
102
*APCI-
Results and Discussion
Reproducibility (%RSD), ranging from 3% to 11% for all
analytes, was very good. Accuracy (recovery percentages),
ranging between 72% to 94% for all compounds in
spiked matrix, was satisfactory and indicated high
performance of our method. Results are shown in Table 3.
Matrix effects are very important when developing an
LC-MS/MS method and can affect reproducibility and
accuracy
14
. This phenomenon was evaluated by comparing
recovery percentages in Milli-Q
®
water and surface water
samples (Mille Iles River) spiked at 50 ng/L (n = 6). We
can consider a very low matrix effect in surface waters
since signal suppression varies from 1% to 13%, except
for atrazine and TCC showing an enhancement signal of
6% and 2%, respectively (Figure 3).
Good linearity in surface water samples was observed
over a concentration range from <LOD to 100 ng/L with
correlation coefficients greater than 0.99 for all
compounds. Detection limits in surface water were in the
range of 0.03 to 2 ng/L (Table 3).
The compounds of interest were investigated using
samples from various surface waters. Figure 4 shows
representative LC-MS/MS chromatograms of selected
compounds in surface water. The concentrations are
illustrated in Figure 5. The selected compounds were
detected in all river samples at various concentrations
depending on sampling locations (Figure 5 a and b).
The highest concentrations were found for caffeine
(16-24 ng/L), atrazine (1.5-39 ng/L), salycilic acid
(10-33 ng/L) and gemfibrozil (4-14 ng/L). The lowest
concentrations were found for carbamazepine (3-5 ng/L),
clofibric acid, and two hormones (progesterone and
estradiol). Trimethoprim, triclocarban and other selected
hormones were detected at trace levels (Trace
≤
limit of
detection).
Overall, concentrations of most of the compounds
analysed were similar to those reported from other areas
in Canada and Europe
3,4
.
Figure 3: Mean recoveries for the extraction of selected compounds using C18-like cartridges (spiked in
Milli-Q water and Mille Iles River water at 50 ng/L, n=6)