
5
Thermo Scienti c Poster Note
•
PN ASMS13_T309_MVogelsang_E 07/13S
Conclusion
The development of the real-tim
quantification of peptide species
thresholds (below 1 e
4
).
Real-time state modeled data ac
identifications than MS1 quantifi
This novel data acquisition sche
peptides in a label-free complex
References
1. Prakash, A.; Peterman, S.; Frew
Vasicek, L.; Hood, B.; Bomgarde
Vogelsang, M.; Worboys, J.; Jor
throughput for highly multiplexe
remote instrument control and st
61
st
ASMS Conference on Mass
MN, June 9–13, 2013. Poster T
number: 131, Tuesday, Halls B&
All trademarks are the property of Thermo Fishe
This information is not intended to encourage us
intellectual property rights of others.
loy label-free quantification of
(XIC). In our typical discovery
old levels as low as 1e
5
.
inpoint software, we can verify
es (demonstrated by loss of
eled acquisition based MS2
ion (Figure 3). As a general
ation for peptides above 2
fy with confidence, is on-par
mtomoles, the quantity and
to nearly 50% of MS2. There is
vel peptides.
d and their corresponding
xpanded view of the
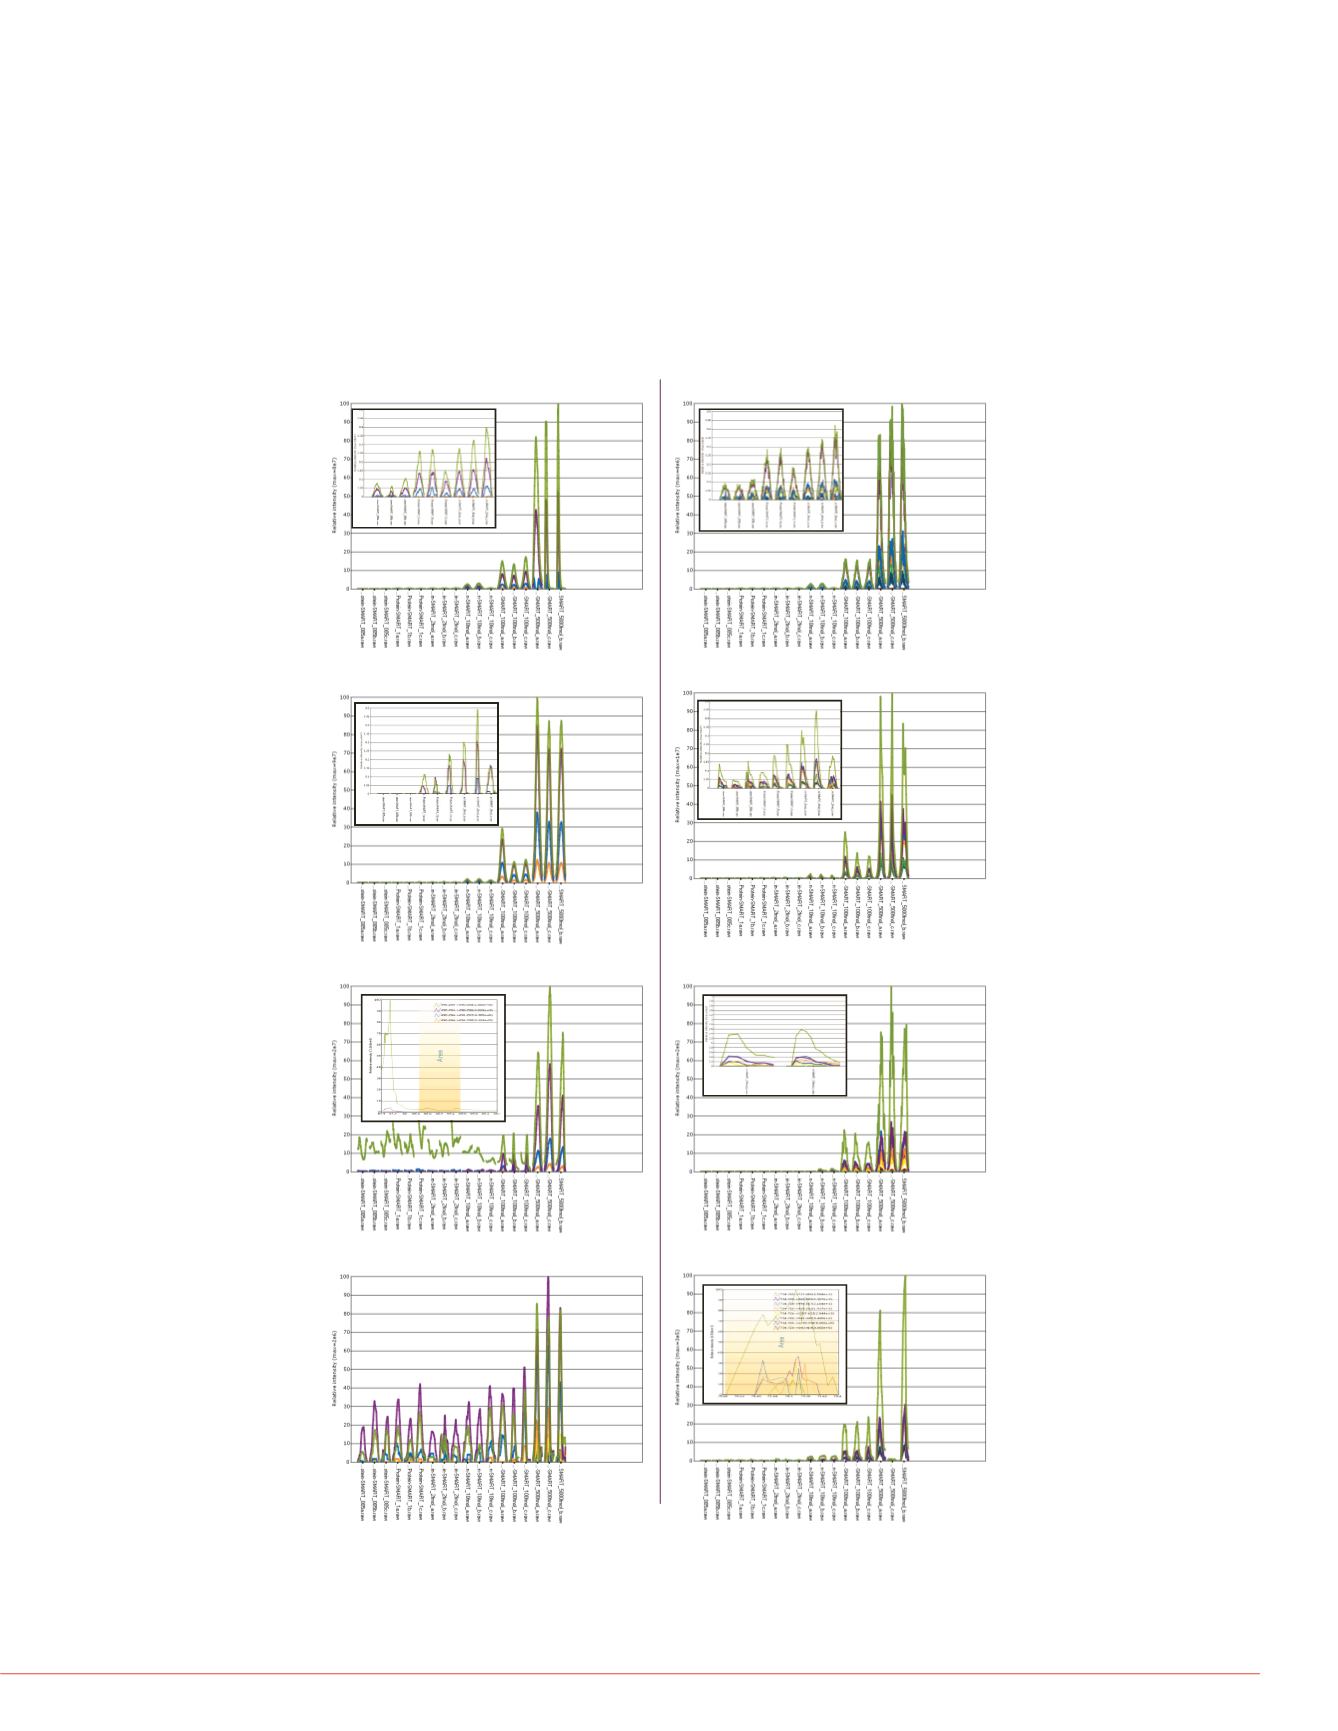
FIGURE 4. Peak profiles for peptides identified at each femtomolar level, for
MS1 quantification (A, C, E) and for MS2 quantification (B, D, F). (A) MS1 peak
profiles for peptide VGDANPALQK. (B) MS2 peak profile view of VGDANPALQK.
Insets (A) and (B) are expanded views of 0.5 to 2 fmol level. (C) and (D) MS1 and
MS2 peak profiles, respectively, for peptide LGEYGFQNALIVR. Insets (C) and
(D) are expanded views of 0.5 to 2 fmol level. (E) and (F) MS1 and MS2 peak
profiles, respectively, for peptide FALPQYLK. Inset (E) shows an expanded view
of probable isobaric contamination from neighboring peak. Inset (F) shows MS2
confidence, 10 fmol level quantification. (G) and (H) MS1 and MS2 peak profiles,
respectively, for peptide DM[Oxid]PIQAFLLYQEPVLGPVR. Inset (H) shows an
expanded view of peak profile for the product ions for the representative
peptide at 10 fmol level.
MS2
MS1
A
B
C
D
E
F
10 fmol
G
H
FIGURE 5. (A) False positive MS1
10 fmol level. (B) XIC for 487.733 i
contaminants; (arrow) points to o
higher levels.
A
that is attained with real-time
of this acquisition scheme is
on column (or at signal
ere both MS1 and MS2 do not
here are significantly fewer


