
4
Improving Label-Free Quanti cation of Plasma and Serum Proteins Using a High-Resolution Hybrid Orbitrap Mass Spectrometer
ata acquisition schemes for
d scanning window, target
n spectral acquisition. Both
s performed to increase the
100
500
in plasma matrix
targeted peptides with confident
level of protein mixture. The bars
tified out of the potential 170
Our current MS-based biomarker discovery studies employ label-free quantification of
proteomic data using MS1 extracted ion chromatograms (XIC). In our typical discovery
experiments, we get MS1 quantification at signal threshold levels as low as 1e
5
.
However, when employing powerful software such as Pinpoint software, we can verify
that some of the MS1 quantification may be false positives (demonstrated by loss of
multiple isotope peaks or isobaric contaminants).
In this study, we compare the novel real-time state modeled acquisition based MS2
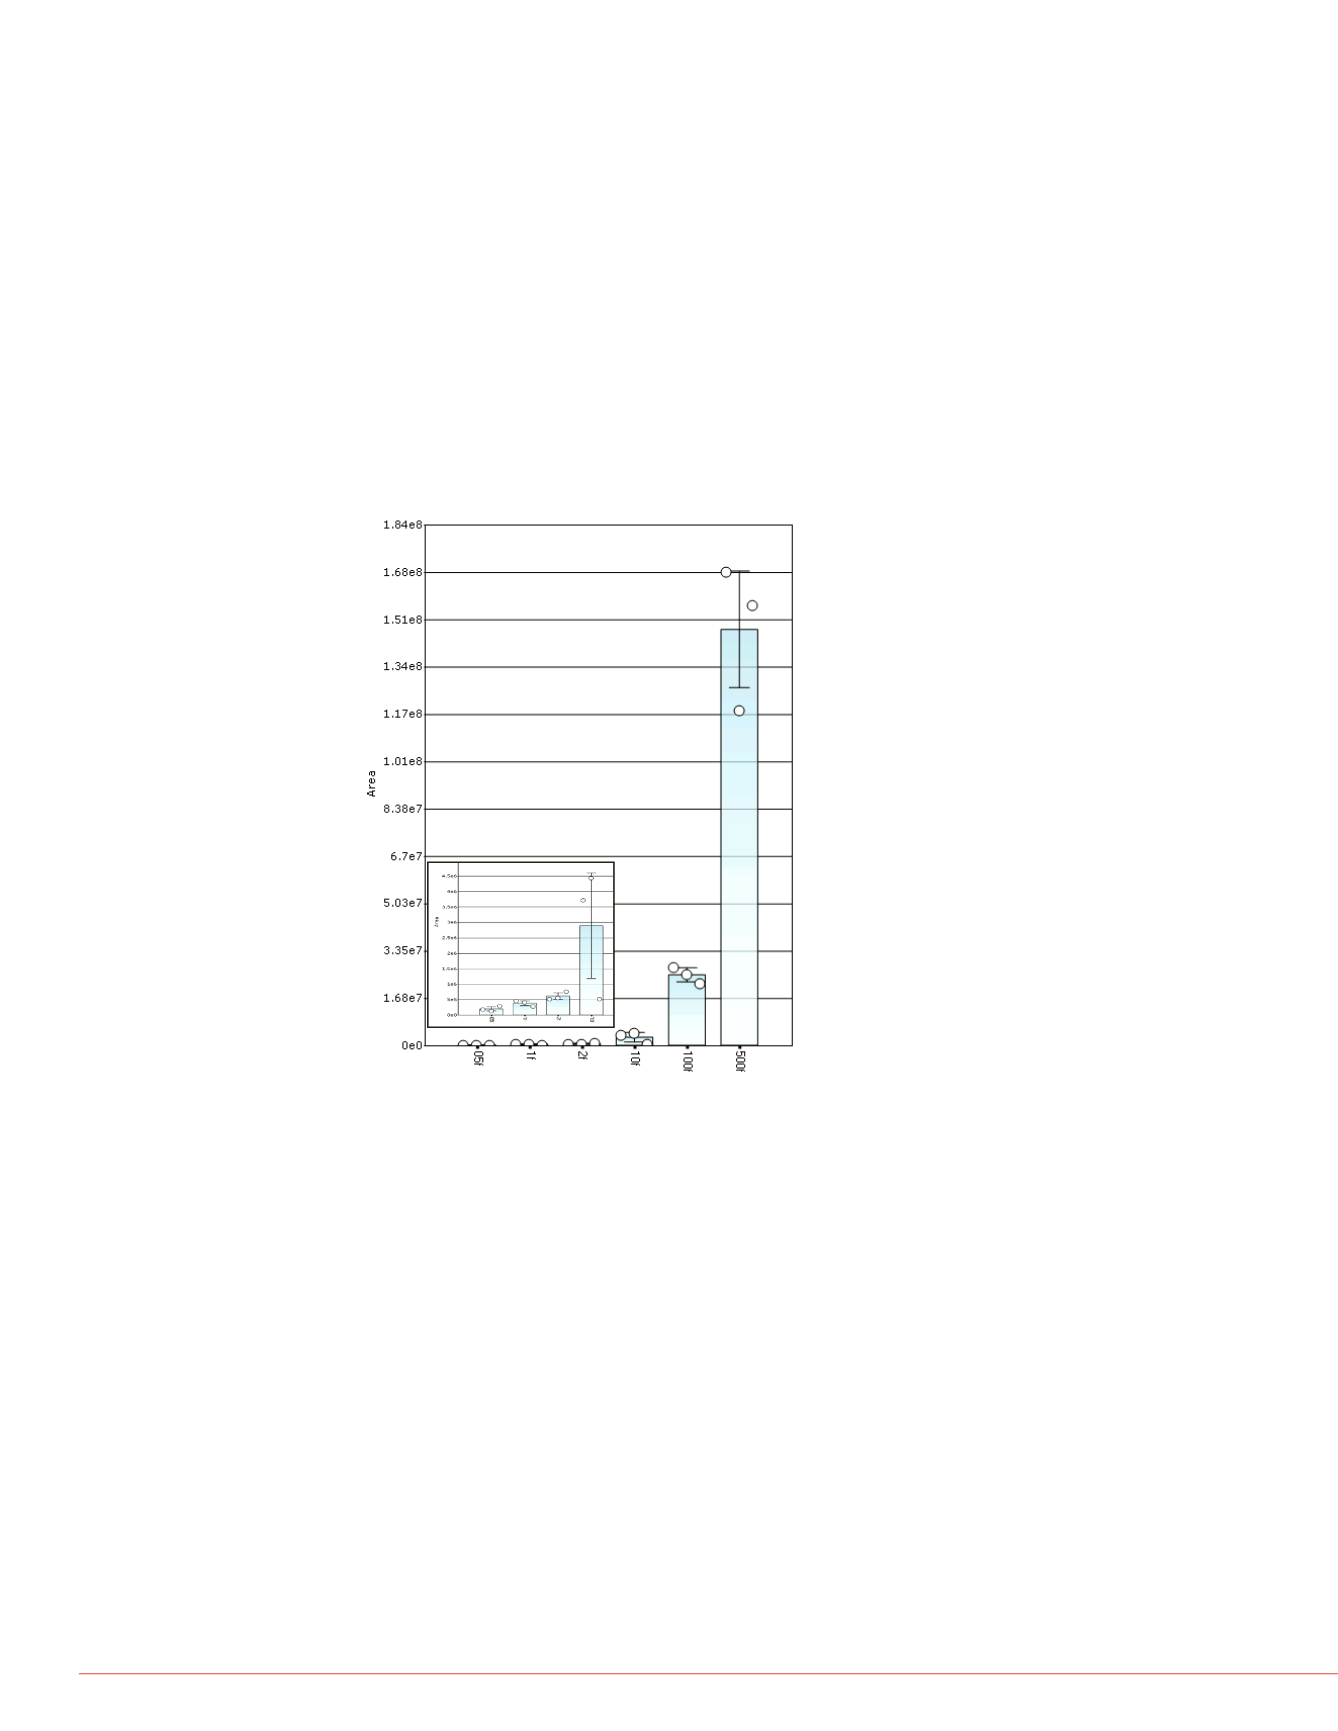
quantification with full scan MS1 (XIC) based quantification (Figure 3). As a general
observation, we see that the quality of the MS1 quantification for peptides above 2
femtomoles, the number of targeted peptides we quantify with confidence, is on-par
with the MS2-based quantification. However, below 2 femtomoles, the quantity and
quality of peptides quantified based on MS1 XIC, drops to nearly 50% of MS2. There is
25–50% false positive quantification at the 0.5–1 fmol level peptides.
VGDANPALQK
FIGURE 3. MS2 Peak area as a function of mass load and their corresponding
variance per run for peptide VGDANPALQK. Inset: Expanded view of the
0.5 to 10 fmol level.
FIGURE 4. Peak profiles for
MS1 quantification (A, C, E)
profiles for peptide VGDANP
Insets (A) and (B) are expan
MS2 peak profiles, respectiv
(D) are expanded views of 0.
profiles, respectively, for pe
of probable isobaric contami
confidence, 10 fmol level qu
respectively, for peptide DM[
expanded view of peak profil
peptide at 10 fmol level.
MS1
A
C
E
G
Figures 4 and 5 demonstrate the increased confidence that is attained with real-time
state-modeled MS2 data quantification. The advantage of this acquisition scheme is
evident at levels of proteins and peptides below 10 fmol on column (or at signal
thresholds below 1 e
4
). There are cases in our study where both MS1 and MS2 do not
quantify a species; however, it is important to note that there are significantly fewer
false-positives with MS2 quantification.
isotope
nse isotope
e (min)
Stop time for “watch list”
Spectral
Library
Experimental
Spectrum


