
3
Thermo Scienti c Poster Note
•
PN ASMS13_T309_MVogelsang_E 07/13S
sed label-free relative
l real-time, intelligent acquisition
lobal targeted quantification.
preferred method for biomarker
ples. Given the right conditions,
d higher throughput. Resulting
periments often leads to targeted
uracy are critical components to
bel-free experiment. Here we
R/AM targeted quantification
scan spectra, and introduce a
tive and quantitative results in
M MS and MS/MS schemes in
ted method building, data
using novel acquisition
rome c (horse),
α
-lactalbumin
(bovine), ovalbumin (chicken),
bovine) — was prepared at
analyzed at 100 fmol on column
spiked into a human plasma
investigated in the human
500 fmol each protein on
n a Thermo Scientific™
rmo Scientific™ Nanospray Flex
te traditional workflows. Initial
MS acquisition resulting in
ectral library. These initial data-
of the eight protein mix (without
protein) on column in a plasma
ependent runs were searched
ht additional proteins. The
used to build a local spectral
es and relative abundance
highly multiplexed, targeted
sed for automated data
es to the acquisition scheme.
please visit poster 131 on
.3 and Thermo Scientific™
o analyze both the qualitative
m initial runs was used to create
erform qual/quan determination
and relative quantification were
amples were run in triplicate.
ased data-dependent acquisition
ell as in a complex plasma
rom the eight proteins were used
gets were built into a spectral
odeled acquisition. The look-up
charge state as well as the
iate product ion spectral
r isotopes during the expected
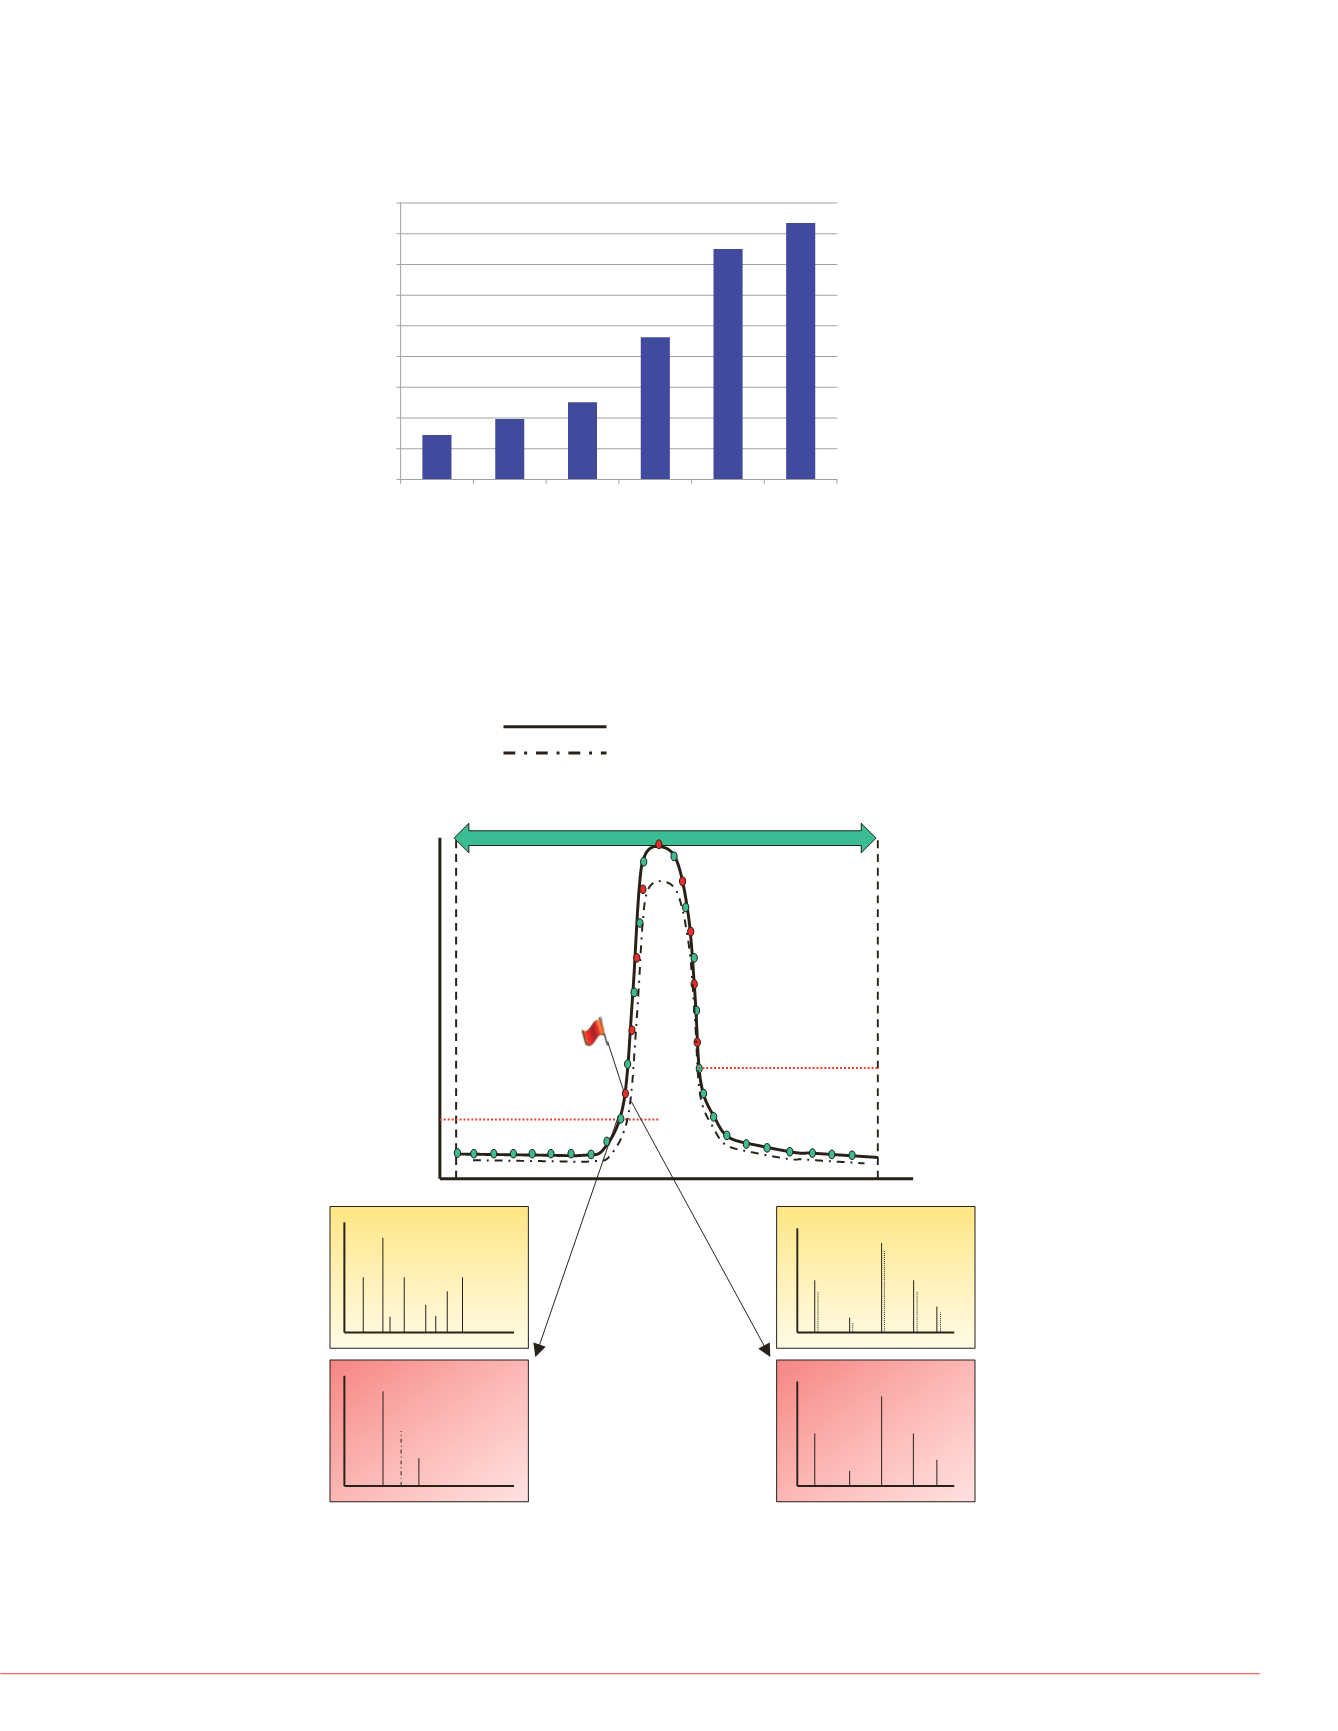
FIGURE 2. Pictorial representation of high IQ data acquisition schemes for
targeted peptide quantification using a targeted scanning window, target
elution identification, and real-time product ion spectral acquisition. Both
precursor and product ion spectral matching is performed to increase the
selectivity of data acquisition.
0
20
40
60
80
100
120
140
160
180
0.5
1
2
10
100
500
Number of targeted peptides per mass load
fmol level of each non-human protein spiked in plasma matrix
FIGURE 1. Histogram showing the number of targeted peptides with confident
MS2 peak area quantification per femtomolar level of protein mixture. The bars
represent the number of confident areas quantified out of the potential 170
targets on the spectral library look-up table.
Our current MS-based biomarker di
proteomic data using MS1 extracte
experiments, we get MS1 quantific
However, when employing powerful
that some of the MS1 quantification
multiple isotope peaks or isobaric c
In this study, we compare the novel
quantification with full scan MS1 (X
observation, we see that the quality
femtomoles, the number of targete
with the MS2-based quantification.
quality of peptides quantified based
25–50% false positive quantificatio
VGDANPALQK
FIGURE 3. MS2 Peak area as a fu
variance per run for peptide VGD
0.5 to 10 fmol level.
Figures 4 and 5 demonstrate the in
state-modeled MS2 data quantificat
evident at levels of proteins and pe
thresholds below 1 e
4
). There are c
quantify a species; however, it is im
false-positives with MS2 quantificat
*
*
Most intense isotope
2
nd
most intense isotope
Measured Ion Intensity
Retention Time (min)
Start time for “watch list”
Stop time for “watch list”
Triggering
Threshold
1.
Spectral
Library
Experimental
Spectrum
Theoretical
Isotope
Experimental
HR/AM MS
Spectrum


