
4
Enrichment of EGFR/PI3K/AKT/PTEN Proteins for Research using Immunoprecipitation and with Mass Spectrometry-based Analysis
ng
g, less void volume reduces the
ation (60 minutes start to finish)
nsistency
cibility
re efficiency and selectivity.
e directly coupled antibody or
in resin. A) Capture efficiency was
e coverage and background proteins
trypsin digestion. IP using magnetic
ntified and higher EGFR sequence
research method development.
x and analyzed by silver stain or
es are also digested with trypsin and
uantitative peptides. Heavy isotope-
used in targeted SRM or MRM
In-Solution nLC-MS/MS Results
uccess Criteria: <60 >60%
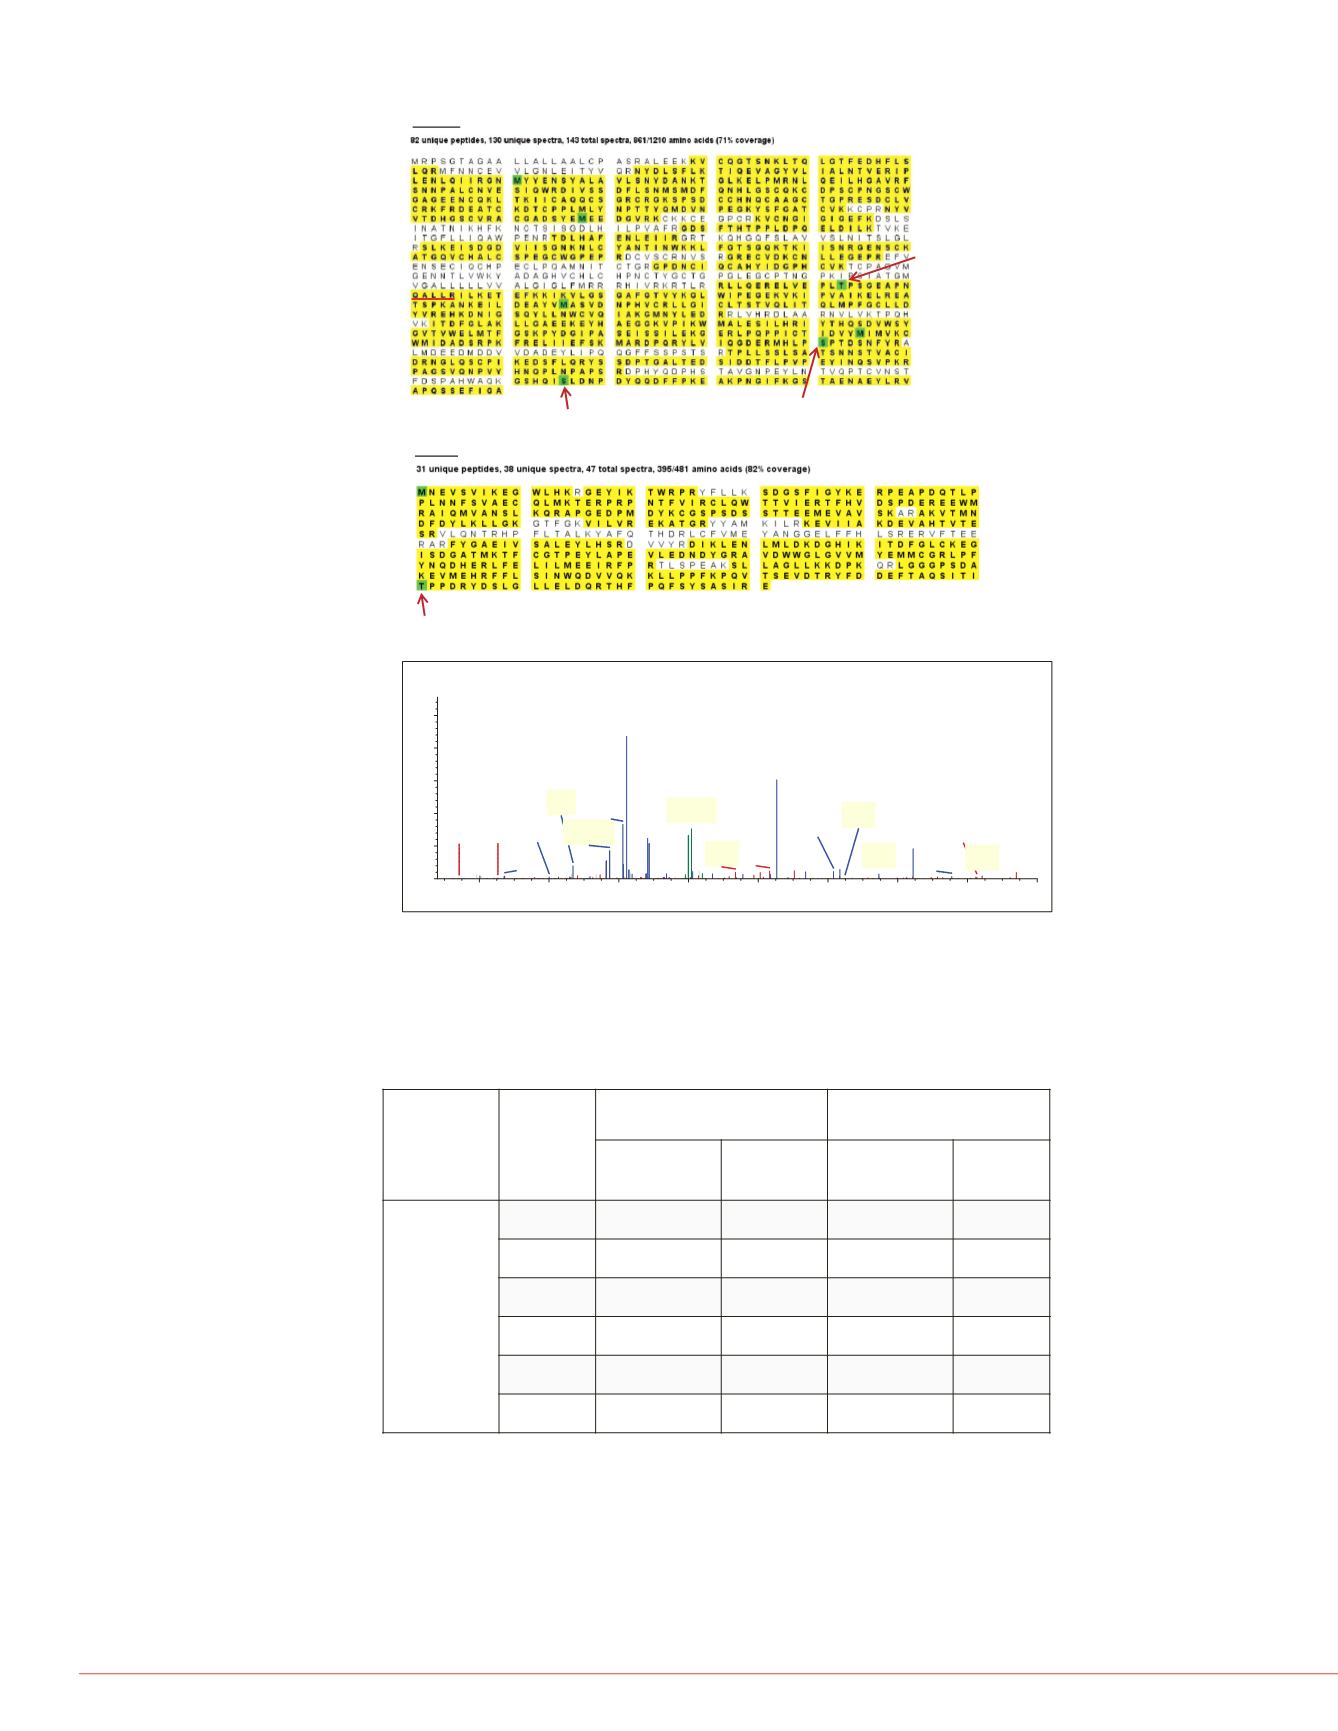
FIGURE 4. Identification of multiple phosphorylation sites for EGFR peptides.
A
B
A) IP-MS allowed simultaneous analysis of multiple phosphorylation sites for EGFR
and AKT2 peptides. B) MS/MS spectra of ELVEPL(pT)PSGEAPNQALLR peptide
showing phosphothreonine residue at T693 of EGFR.
Enrichment of medium to low abundant targets using Thermo Scientific Pierce
Streptavidin Coated Magnetic Beads
EGFR-AKT pathway targets were immunoprecipitated from two cell lines with
biotinylated antibodies, captured with Pierce Streptavidin coated magnetic beads,
washed, eluted, digested in-solution, and analyzed by LC-MS/MS to assess sequence
coverage and identify isoform-specific peptides.
Target
A431
HEK293
Anti-target
Ab
Negative
Control
Anti-target
Ab
Negative
Control
%
Sequence
Coverage
EGFR
65%
0%
16%
0%
AKT1
36%
2%
68%
6%
AKT2
50%
0%
82%
0%
AKT3
8%
0%
62%
0%
PTEN
16%
0%
36%
0%
PIK3CA
0%
0%
0%
0%
AKT2
EGFR
1166-Phosphoserine
693-
Phosphothreonine
by PKD/PRKD1
991-Phosphoserine
451-Phosphothreonine
b₃⁺
342.19
y₁₄⁺-P
1448.85
b₄⁺-H₂O
453.25
b₁₇⁺
1826.83
y₅⁺
600.44
y₁₆⁺-H₂O
1754.86
y₄⁺
472.50
b₁₈⁺-P
1842.06
y₃⁺
401.40
y₁₅⁺-P
1545.87
b₁₈⁺
1940.12
b₁₁⁺-P
1134.60
y₁₃⁺-H₂O
1415.81
b₁₁⁺
1232.60
b₁₂⁺
1303.60
y₁₃⁺
1433.92
y₁₃²⁺-P
668.54
y₁₅²⁺-P, y₁₄²⁺
773.56
y₁₅⁺
1643.90
y₈⁺
882.59
[M+2H]²⁺-P
1008.67
y₇⁺
811.60
y₁₂⁺
1252.78
y₁₅²⁺
822.53
400
600
800
1000
1200
1400
1600
1800
2000
m/z
0
5
10
15
20
25
Intensity [counts] (10^3)
Extracted from: R:\Bhavin\IP-MS\IPMS_5Kits_May2013\EGFR\Batch2\IP_PMS_EGFR_R1_1.raw #2257 RT: 31.37
ITMS,CID@35.00,z=+2,Monom/z=1057.53271Da,MH+=2114.05815Da,MatchTol.=0.5Da
ELVEPL(pT)PSGEAPNQALLR
FIGURE 5. Detection and
and PIK3R1 peptides.
All six targets were monitor
and PIK3R1 peptides were
Target
Peptide No.
EGFR
Peptide 1
Peptide 2
AKT2
Peptide 1
Peptide 2
AKT1
Peptide 1
PTEN
Peptide 1
Peptide 2
PIK3R1
Peptide 1
Peptide 2
PIK3CA
Peptide 1
FIGURE 6. Quantitation of
Enrichment of EGFR from t
peptides by targeted MS. B
Magnetic beads compared t
Immunoprecipitation to ta
After enrichment by IP, SRM
PTEN proteins in the low fm
FIGURE 7. Recovery of re
rEGFR spiked into 1mg pla
Monoclonal antibody recov
rEGFR
Mono
Ab
0 ng
0%
7 ng
3%
36 ng
20%
180 ng
42%
nLC-MS/MS
(EGFR % Sequence Cove
A431
FIGURE 8. Multiplex imm
EGFR, AKT isoforms and P
biotinylated antibodies, cap
targets were identified and
Targets/
HEK293 lysate
% Seque
Covera
EGFR
17%
AKT2
23%
AKT1
16%
PTEN
11%
nLC-MS/MS


