
3
Thermo Scientific Poster Note
•
PN64231-EN 1114S
ast and cost efficient analysis
nalyzed with 8 minute LC-MS
adrupole mass spectrometer.
ethod producing data which
nd robustness.
ounds for analysis. The need
firmation is continually
peed sample analysis time,
ping good data quality.
at 60 C.
spiking solution in methanol.
effects.
d as internal standards.
µm , 5 0x 2.1 mm
cid in water (Fisher
cid in methanol water
TABLE 2. Limits of quantitation a
sample with concentration either
Analytes in this table are listed in
d, including solvent
Results
ass spectrometer with a
s the detector. Two SRM
transition was collected for
e scheme is presented in
performed using Thermo
Analyte
LOQ
(ng/ml)
Pr
%R
Morphine
50
Nicotine
10
Zonisamide
50
Oxymorphone
5
Hydromorphone
20
7-Aminoclonazepam
2
Meprobamate
1
Benzoylecgonine
2
Codeine
20
Pregabalin
100
6-MAM
20
Noroxycodone
20
Oxycodone
10
Norhydrocodone
50
Hydrocodone
20
Amphetamine
5
Carisoprodol
2
Lorazepam
50
a-Hydroxyalprazolam
100
Methamphetamine
1
MDMA
2
Temazepam
10
Clonazepam
50
Nordiazepam
50
%B
0
20
70
100
100
00.0
0
0
Method Performance Evaluation
Calibration standards and QC samples were prepared in artificial urine.
Concentration of the highest calibration standard was limited by concentration of
individual analytes stock solutions (1 mg/mL) purchased from Cerillant.
The following method performance parameters were obtained:
•
LOQ:
precision within 20% and ion ratio within specified range
•
Linearity range
: all calibrators accuracy 15%
•
Precision:
5 replicates of QC samples
•
Matrix effects
: Internal standard peak area %Recovery in donor samples (n=40)
calculated against internal standard peak area in water.
Figure 1.
SRM transitions acquisition scheme in mass spectrometer method.
Deuterated internal standards for each analyte (not listed at the graph) were
analyzed with the same analyte specific time windows.
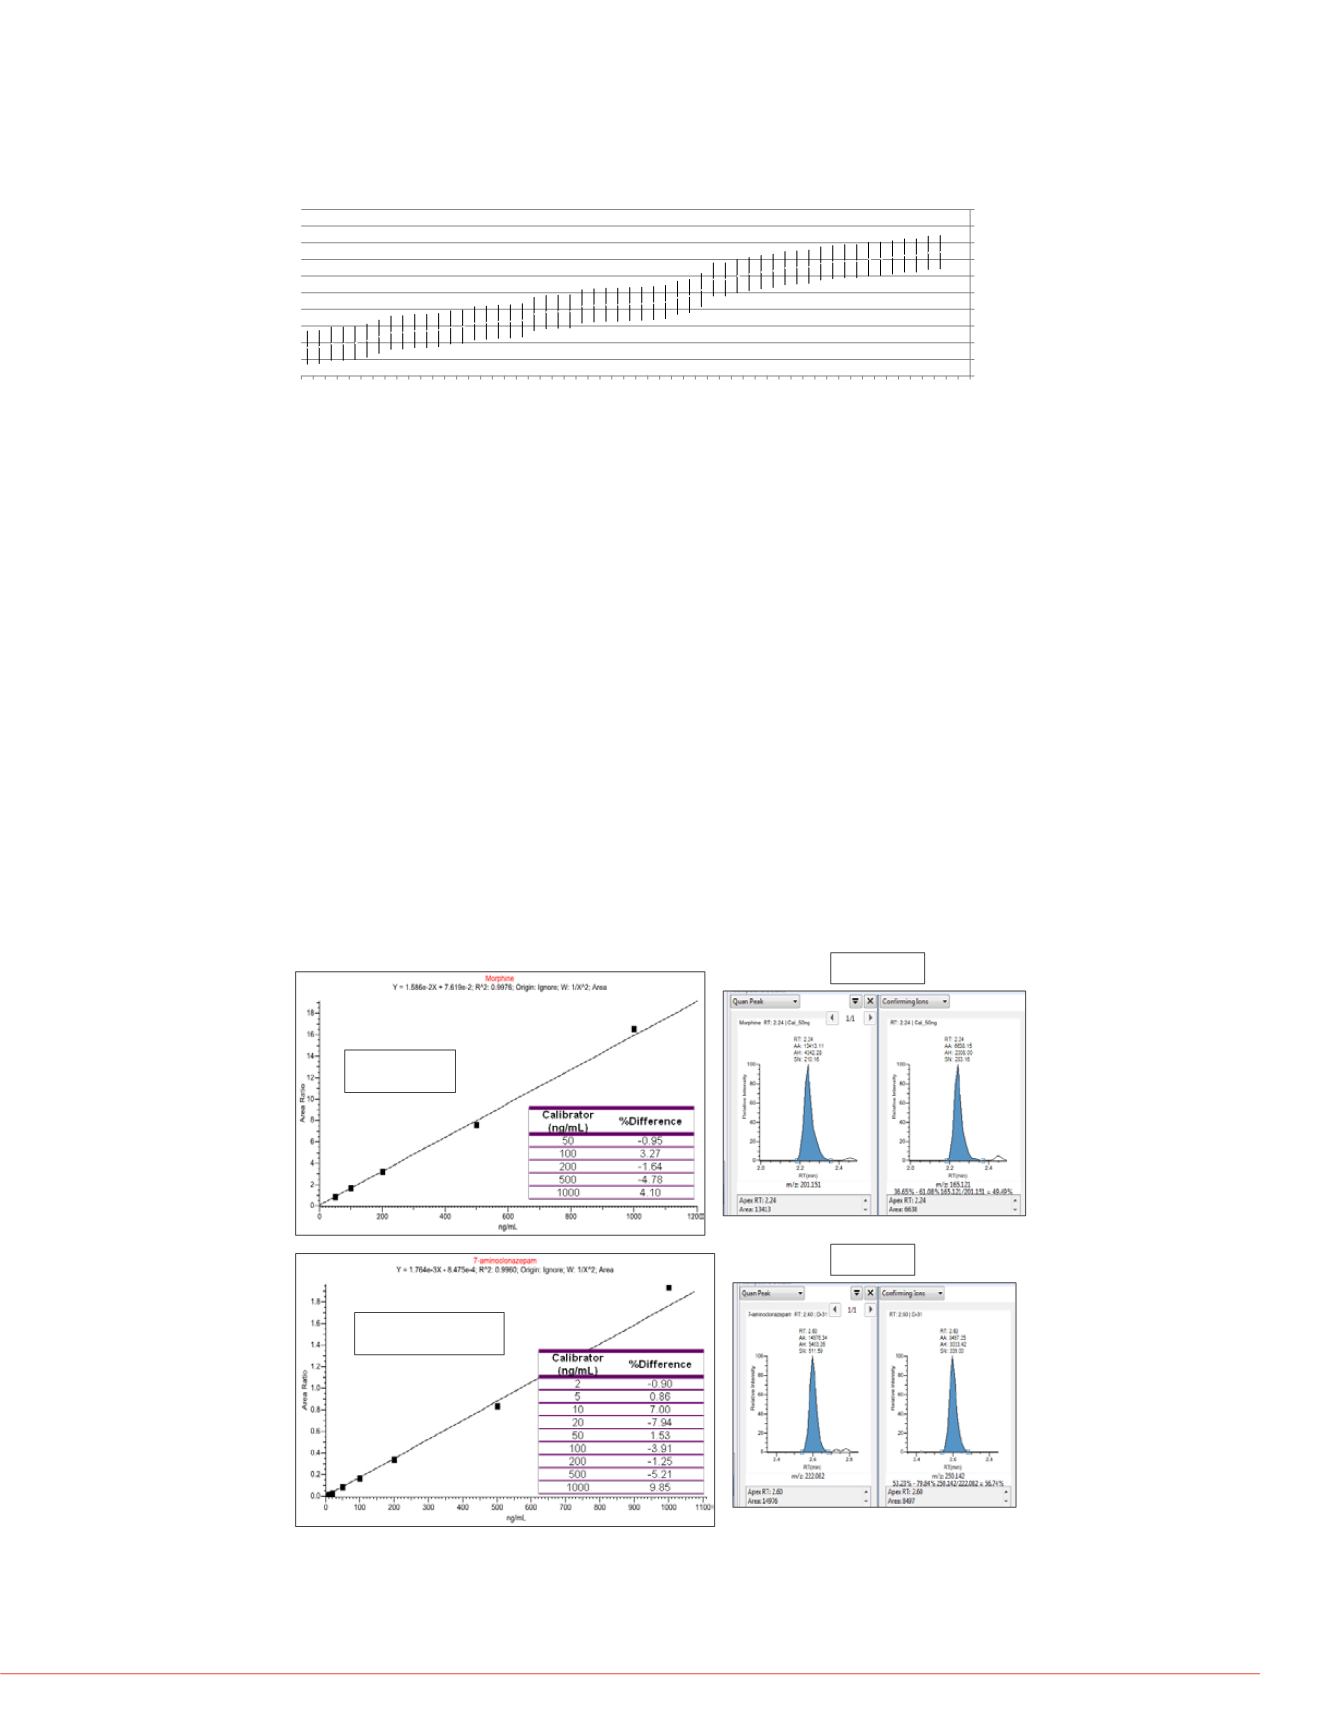
Figure 1. Calibration curves and chromatograms of the lowest calibration
standards showing quantifier and qualifier ions for selected analytes.
1.5
2
2.5
3
3.5
4
4.5
5
5.5
6
6.5
Morphine
nicotine
Zonisamide-neg
Zonisamide
Oxymorphone
Hydromorphone
7-aminoclonazepam
Meprobamate
phenobarbital
Benzoylecgonine
gabapentin
codeine
Pregabalin
6 MAM
noroxycodone
butalbital
Oxycodone
norhydrocodone
Hydrocodone
Amphetamine
Carisprodol
Lorazepam
a-hydroxyalprazolam
Methamphetamine
MDMA
Clonazepam
Temazepam
Nordiazepam
Alprazolam
Norfentanyl
tapentadol
Diazepam
tramadol
Norbuprenorphine
THCA-pos
THCA_neg
diphenhydramine
Buprenorphine
Zolpidem
doxepin
Duloxetine
Fentanyl
dextromethorphan
Cyclobenzaprine
desipramine
nortriptyline
protriptyline
imipramine
amitriptyline
PCP
EDDP
trimipramine
clomipramine
Methadone
Retention Time (min)
7-aminoclonazepam
2-1000 ng/mL
Morphine
50-1000 ng/mL
50 ng/mL
7-aminoclonazepam
2-1000 ng/mL
2 ng/mL
Calibra
(ng/m
5
10
20
50
100
200
500
1000
Tramadol
5-1000 ng/mL
Methadone
2-1000 ng/mL
Figure 1. (continued)


