
8
Evaluating New ToxFinder Data Processing Software in Targeted Screening Applications Implemented on Orbitrap Ultra High Resolution Mass Spectrometers and
Triple Quadrupole Mass Spectrometer
T Fi d d t
i
ox n er a a rev ew
User may chose to report only identified compounds or all analytes listed
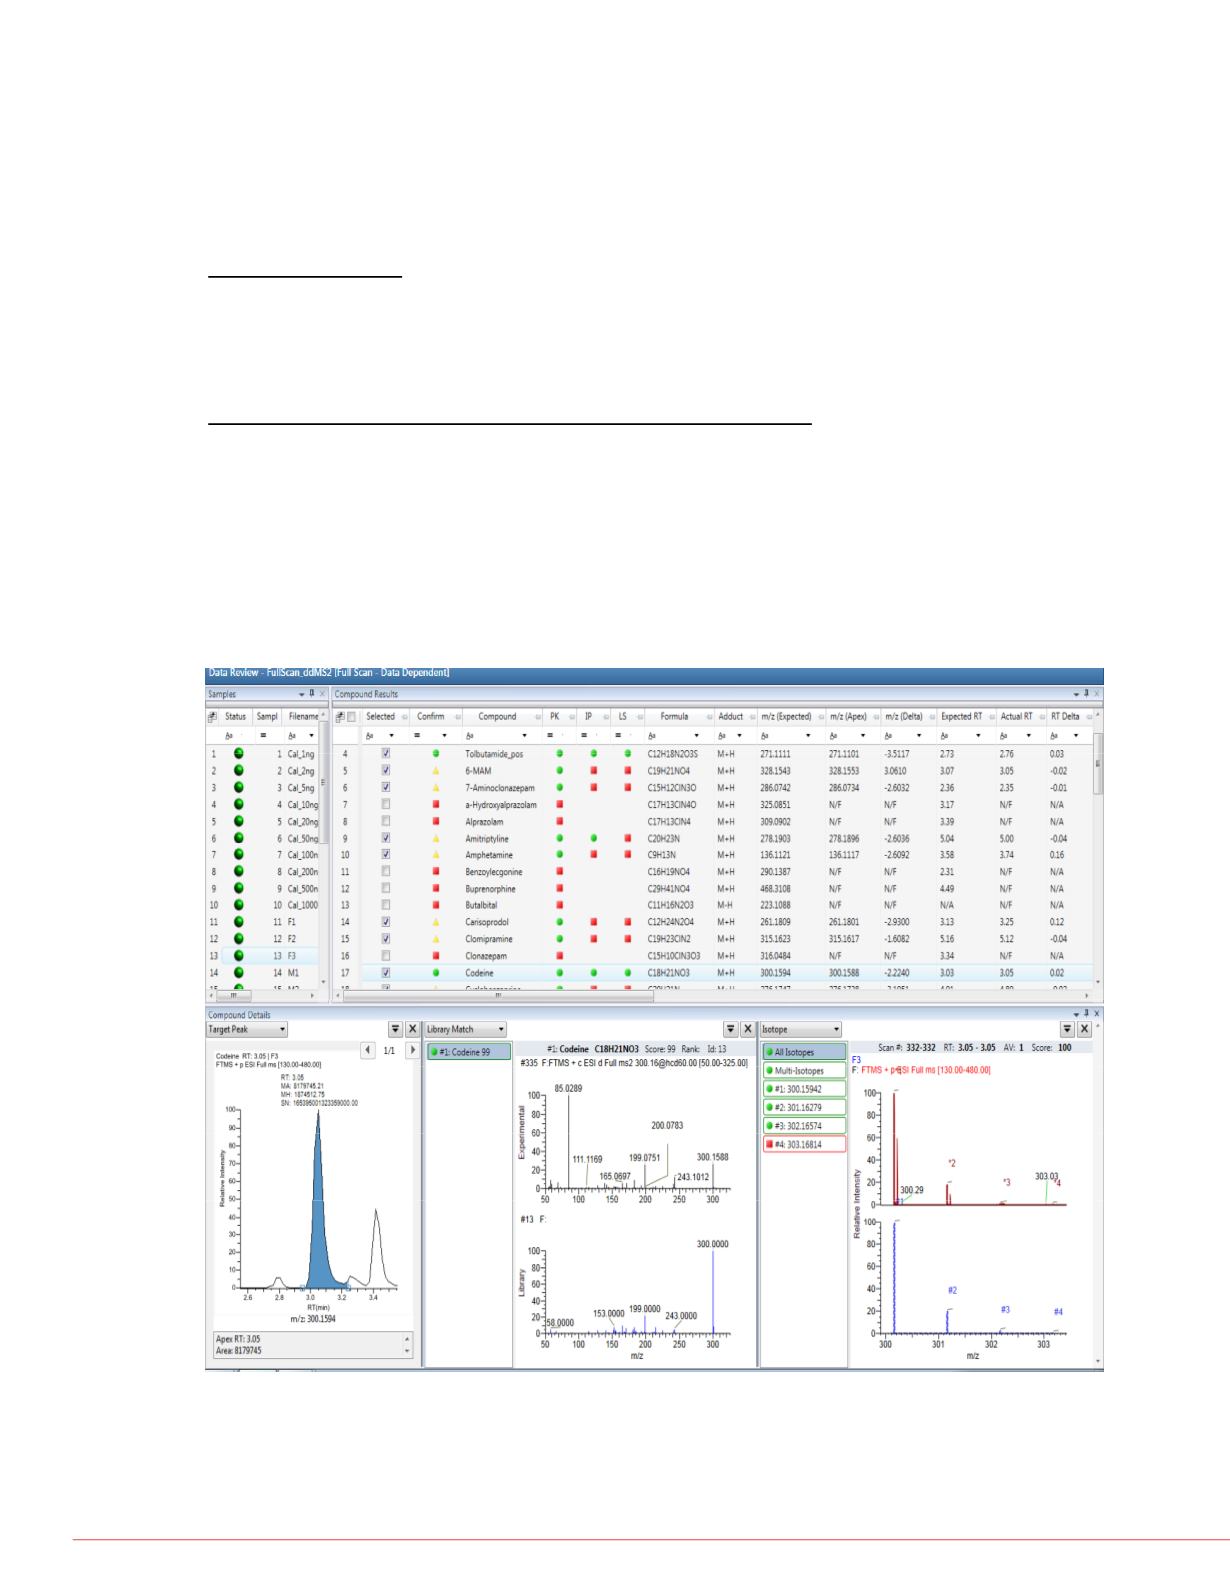
in the method Figures 5 and 6 presents data review screen for Full scan-
ta processing
.
dd MS2 method with the status of all analytes in the method shown sorted
followed by
,
mediate report
alphabetically.
Flags
Confirmation Flag
Green: compound detected and confirmed
Yellow: compound detected but not confirmed
Red: compound not detected
Identification criteria specific flags: green=pass, red=fail
PK: Peak detection flag
Method
IP I t i
tt
fl
development
: so op c pa ern ag
LS: Library search flag
IR: Ion ratio flag
FR F
t d t ti
fl
: ragmen s e ec on ag
FIGURE 5 T Fi d d t
i
C
d lt t bl
ith
. ox n er a a rev ew page: ompoun resu s a e w
compound chromatogram, library search and isotopic match results.
Routine
analysis
eet allowing
rted from a
d mpoun
ple of a
an and AIF
ti
ti
n on me,
nd, optionally,
lication
Figure 6 ToxFinder semi-quantitative calculations for urine spiked at a
.
concentration of 100 ng/mL.


