
4
Quantitation of 47 Forensic Compounds in Urine by HPLC-MS
TABLE 2. Limits of quantitation and intra-assay precision for the lowest QC
sample with concentration either 10, 50 or 200 ng/mL according to LOQ.
Analytes in this table are listed in order of retention time.
Analyte
LOQ
(ng/ml)
Precision
%RSD (n=5)
Analyte
LOQ
(ng/ml)
Precision
%RSD (n=5)
Morphine
50
7.14
Alprazolam
2
10.2
Nicotine
10
10.1
Norfentanyl
5
14.3
Zonisamide
50
5.60
Tapentadol
2
4.82
Oxymorphone
5
7.08
Diazepam
20
5.47
Hydromorphone
20
3.36
Tramadol
5
5.81
7-Aminoclonazepam
2
13.5
Diphenhydramine
2
3.72
Meprobamate
1
12.6
Buprenorphine
20
9.27
Benzoylecgonine
2
4.32
Zolpidem
1
1.81
Codeine
20
4.11
Doxepin
20
10.3
Pregabalin
100
4.62
Duloxetine
20
5.46
6-MAM
20
8.94
Fentanyl
1
4.90
Noroxycodone
20
9.85
Dextromethorphan
2
5.69
Oxycodone
10
9.42
Cyclobenzaprine
2
5.40
Norhydrocodone
50
8.21
Desipramine
50
3.98
Hydrocodone
20
5.95
Nortriptyline
2
6.24
Amphetamine
5
1.90
Protriptyline
50
13.3
Carisoprodol
2
9.55
Imipramine
10
7.28
Lorazepam
50
11.0
Amitriptyline
5
4.63
a-Hydroxyalprazolam
100
5.10
PCP
1
2.47
Methamphetamine
1
6.10
EDDP
2
3.49
MDMA
2
5.63
Trimipramine
10
4.33
Temazepam
10
13.9
Clomipramine
50
3.66
Clonazepam
50
11.4
Methadone
2
1.99
Nordiazepam
50
17.9
n artificial urine.
ited by concentration of
d from Cerillant.
tained:
ed range
y in donor samples (n=40)
pectrometer method.
d at the graph) were
the lowest calibration
selected analytes.
1.5
2
2.5
3
3.5
4
4.5
5
5.5
6
6.5
diphenhydramine
Buprenorphine
Zolpidem
doxepin
Duloxetine
Fentanyl
dextromethorphan
Cyclobenzaprine
desipramine
nortriptyline
protriptyline
imipramine
amitriptyline
PCP
EDDP
trimipramine
clomipramine
Methadone
Retention Time (min)
50 ng/mL
2 ng/mL
Analyte
Morphine-d3
Nicotine-d4
Zonisamide-13C6
Oxymorphone-d3
Hydromorphone-d6
7-Aminoclonazepam-d4
Meprobamate-d7
Benzoylecgonine-d3
Codeine
Pregabalin-d6
6-MAM-d3
Noroxycodone-d3
Oxycodone-d3
Norhydrocodone-d3
Hydrocodone-d6
Amphetamine-d3
Carisoprodol-d7
Lorazepam-d4
a-Hydroxyalprazolam-d5
Methamphetamine-d5
MDMA-d5
Temazepam-d5
Clonazepam-d4
Nordiazepam-d5
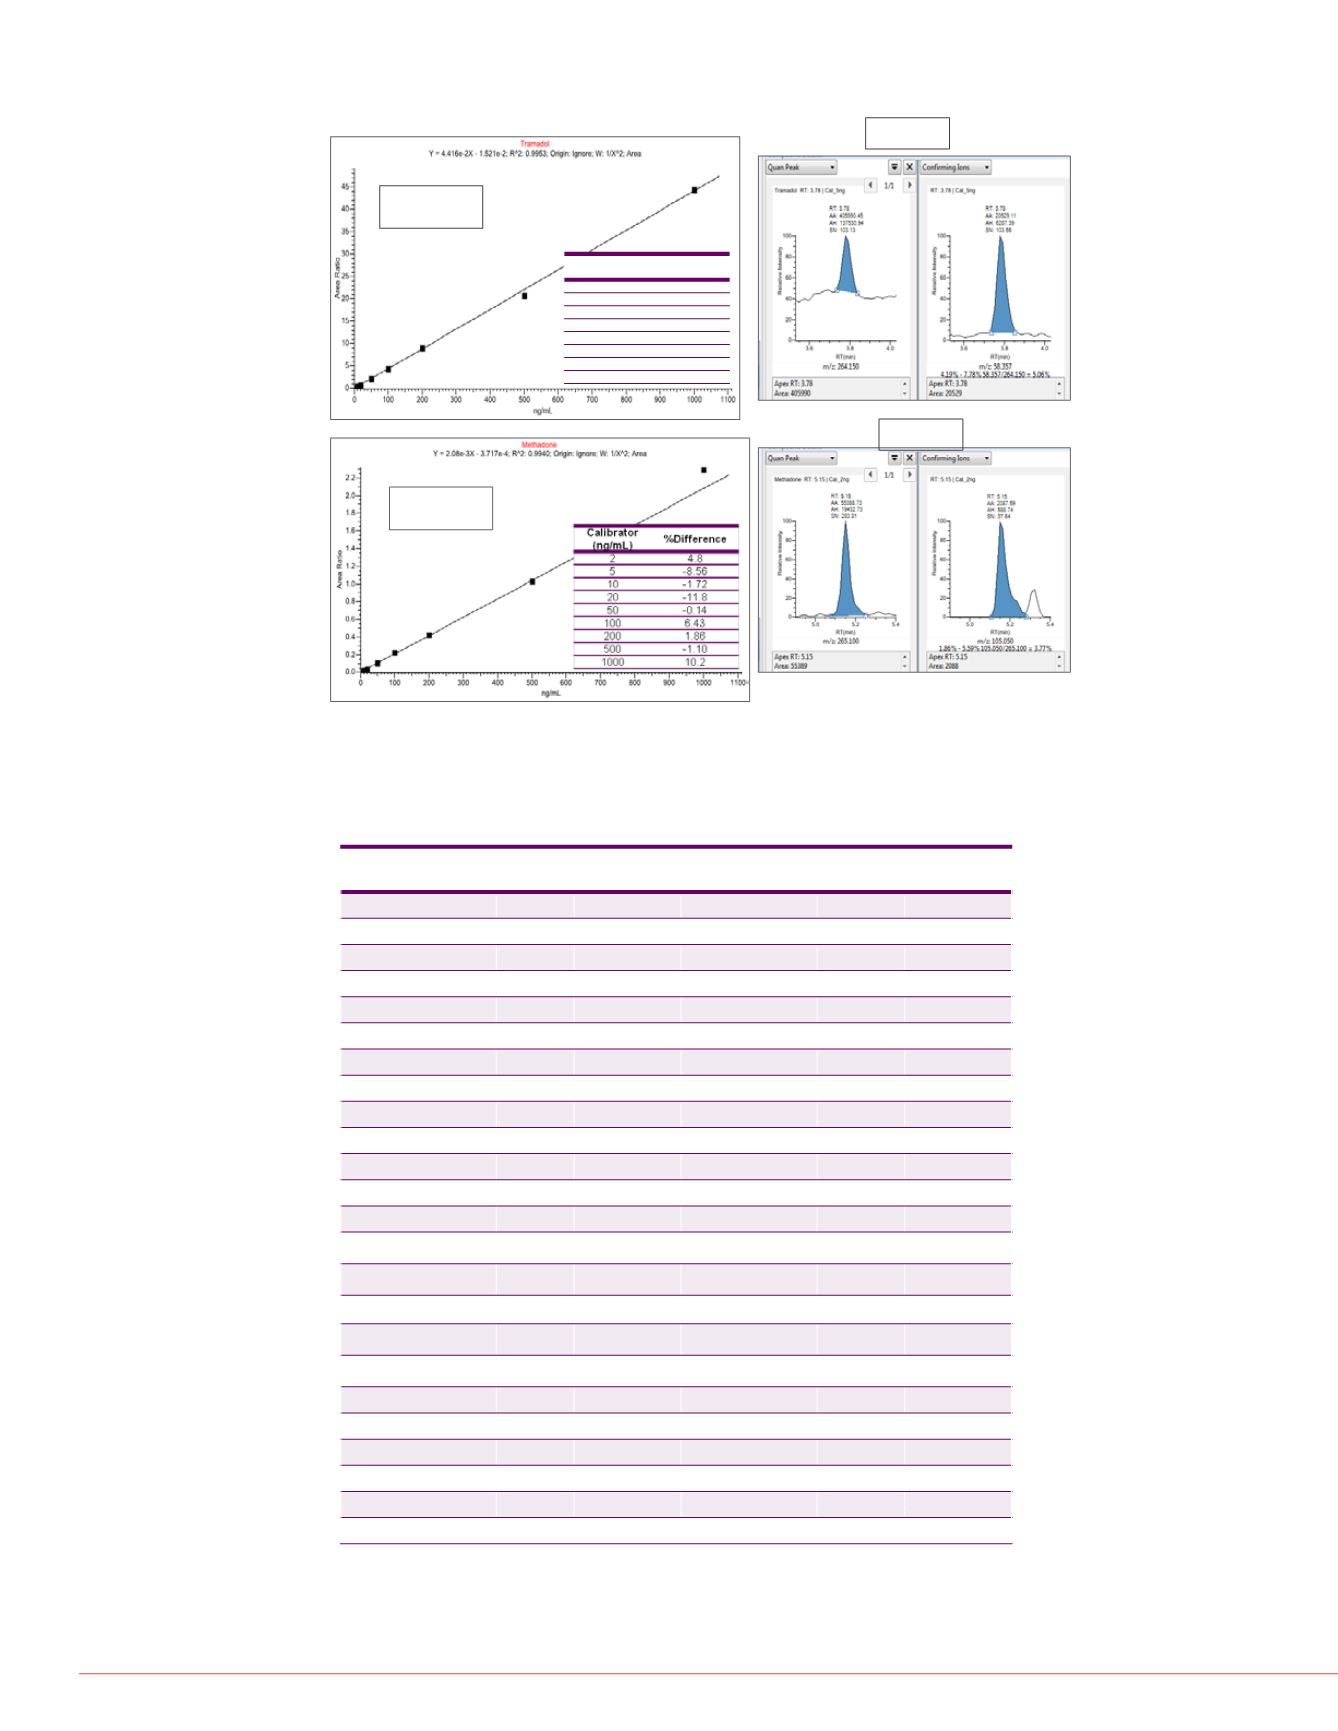
Table 4. Matrix effects: Mean
samples.
Calibrator
(ng/mL)
%Difference
5
4.28
10
8.83
20
-11.8
50
4.37
100
-0.12
200
2.13
500
-5.71
1000
0.53
Tramadol
5-1000 ng/mL
Methadone
2-1000 ng/mL
Figure 2. Matrix effects: Inte
some of the least and the m
0
20
40
60
80
100
120
140
S1
S3
S5
S7
S9
S11
S13
S15
S17
S19
S21
Figure 3. Chromatograms fro
are those with lowest analyze
Fentanyl 64.6 ng/mL
5 ng/mL
2 ng/mL
Figure 1. (continued)


