
Mass Spectrometry
Thermo Scientific TSQ Quantum Ultra
Ion Source & polarity:
HESI, positive ion mode
Spray Voltage:
4750 V
Vaporizer Temperature:
450 °C
Sheath Gas:
50 units
Ion Sweep Gas:
5 units
Auxillary Gas:
60 units
Capillary Temperature:
200 °C
Collision Gas Pressure:
1.5 mTorr
The SRM transitions used for this experiment are
presented in Table 2.
Results and Discussion
Prior to the analysis of spiked whole blood samples, opiate
analytes were spiked into 100% acetonitrile and analyzed by
the TurboFlow and LC-MS/MS method in order to demon-
strate that the high organic content of the sample did not
affect peak shape (peak splitting, etc.). The extracted,
spiked whole blood samples were analyzed using the same
TurboFlow method. Samples were run from low to high
concentration with a solvent blank sample submitted after
the highest concentration sample to calculate carryover.
In all analyses, 10 µL of the extracted sample was injected
and replicated to generate a calibration curve.
The extracted ion chromatograms of the lowest
concentration sample and highest concentration sample are
presented in Figures 1 and 2 respectively. The calibration
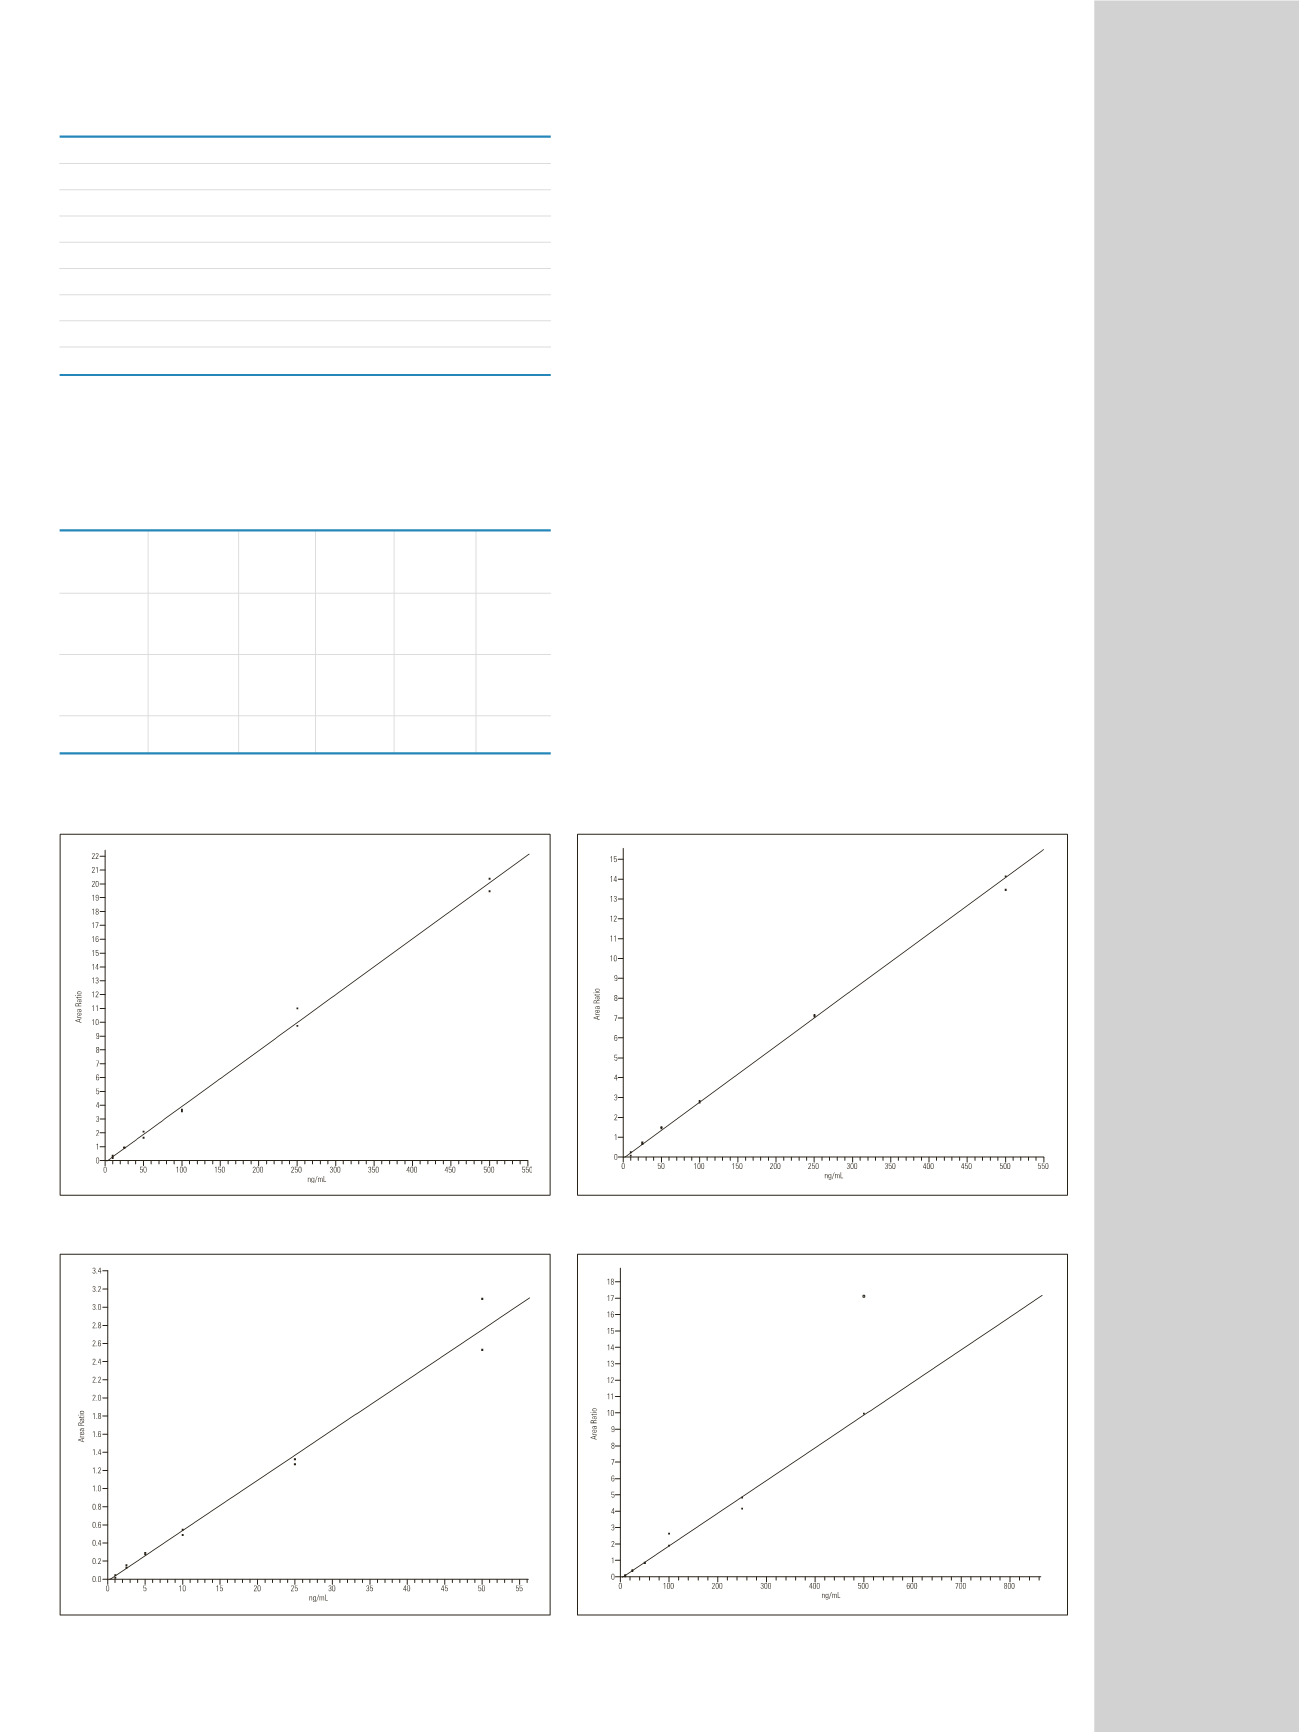
curves for morphine, codeine and M3G/M6G covered
10–500 ng/mL (Figure 3, 4 and 6) and for the 6-MAM
metabolite the curve covered 1–50 ng/mL (Figure 5).
The isotopically labeled internal standard (d6-codeine)
was spiked into each sample at 50 ng/mL. The
concentration data for each analyte are provided as blood
equivalents, i.e. the concentration in the blood before
extraction. For example, 1 ng/mL blood equivalent was
actual 0.43 ng/mL in the sample vial (150 µL diluted with
350 µL acetonitrile). Therefore, the equivalent on column
amount of the lowest 6-MAM standard was 4.3 pg.
Scan Collision Tube
Analyte
Parent
Product
Time Energy Lens
Morphine 286.13
165
5 ms
39
133
201
5 ms
25
133
Codeine
300.14
165
5 ms
38
148
215
5 ms
26
148
6-MAM 328.13
165
5 ms
38
145
211
5 ms
25
145
M3G/M6G 462.16
286
5 ms
31
155
Figure 3: Calibration curve for the analyte morphine from 10–500 ng/mL
Figure 4: Calibration curve for the analyte codeine from 10–500 ng/mL
Figure 5: Calibration curve for the analyte 6-MAM from 1–50 ng/mL
Figure 6: Calibration curve for the analyte M3G/M6G from 10–500 ng/mL
Table 2: SRM transitions monitored in the experiment


